From the LCROSS Flight Director (Paul Tompkins) Blog. Reposted from https://blogs.nasa.gov/lcrossfdblog/2009/12/16/post_1260990722929/
Kimberly Ennico Note: I contributed the information in Mark Shirley’s addition to this entry in Paul Tompkins (Mission Operations Manager) LCROSS blog series about what was happening on the LCROSS payload during impact night. Mark was sitting in the MOCR/Mission Operations Control Room while I was in the SOC./Science Operations Control across the hallway.
The LCROSS mission was ultimately focused on the final four minutes of flight, starting at the time of the Centaur impact, and ending with the impact of the Shepherding Spacecraft. During that time, the Payload Engineer and the Science Team took operational center stage. Once the science payload was powered on, the team’s job was to confirm the full functionality of the instruments, and then to adjust instrument settings to make sure the data we received was the best it could possibly be. For Impact, there were no second chances – the Shepherding Spacecraft was to be destroyed as a forgone outcome of its observation of the Centaur lunar collision.
In this post, I’ve invited Payload Engineer Mark Shirley to provide his perspective of impact night. Mark was the Payload Software Lead, in charge of the design and implementation of onboard instrument command sequences and other onboard software components, as well as a large fraction of the science-related data processing software used on the ground. During flight, Mark sat in the Mission Operations Control Room (MOCR) with the rest of the Flight Operations team. On the final day, his job was to assess and maintain the engineering functionality of the science payload in those minutes before impact.
In the impact video sequence, from the public’s perspective, there were a lot of things that happened operationally that were probably difficult to understand. Mark will explain the plan for gathering data from the impact and also describe what actually happened in flight. On a lighter note, Mark was one half of our now famous (or notorious) “high-five malfunction” that created such a buzz on the social media circuit after impact. He’ll explain that as well. I’ll let Mark take it from here. Enjoy!
I’d like to describe our plan for collecting data about the Centaur impact from the shepherding spacecraft (S-S/C), how actual events differed from the plan, and what that says about the process of developing and flying spacecraft. In particular, I’ll cover why some of the pictures were fuzzy and some were white and why we were sending commands during the last minutes. I won’t touch on the scientific interpretation of the data, only the process of gathering it. This story contains some hard work, a few mistakes, a little nail biting tension, and finally, success.
Central to the story is the type of mission LCROSS was: a cost-capped, fixed-schedule mission. That meant if LCROSS had been late, LRO would have flown with a dead or inactive LCROSS. If the project had run out of money, whatever hadn’t been done wouldn’t have gotten done. Within the LCROSS project, the instruments were in a similar position. The original idea was to observe the Centaur impact from Earth only. Onboard instruments were soon added to the design but with a total instrument budget of approximately $2 million. That’s much less than single instruments on many other missions.
Two things made success possible. First, project managers kept a tight focus on using the barest minimum hardware and testing required to perform the science, and went beyond that, only as the budget allowed, to increase the likelihood of success. Second, everyone stayed on budget. The payload team had no choice, but if any other part of the project had overrun by a lot, the payload might have been eliminated or flown only partially ready.
The LCROSS Instruments
LCROSS carried nine instruments. Five were cameras to take pictures over a large range of wavelengths, that is, colors. One was for visible light that our eyes can see. Two near-infrared cameras captured mineralogy and water signatures, and two mid-infrared cameras captured thermal signatures from -60C to +500C). LCROSS carried three spectrometers to measure color very precisely. One covered ultra-violet and visible wavelengths and two covered near-infrared wavelengths. The latter spectrometers were the best at searching for water, and one looked down toward the Centaur impact the vapor cloud it kicked up and the other looked to the side as LCROSS passed through that cloud. Finally, LCROSS carried a high-speed photometer to measure the brightness of the impact flash.
The instruments are described in detail here. Data from all nine instruments had to share LCROSS’ one Mbps (one megabit or million bits per second) radio link to the ground. At that rate, it takes 2 seconds to transmit a typical cell phone picture. This was the maximum data rate available for the LCROSS mission and used only twice: lunar swingby on June 22nd and impact on October 9th. All other instrument activities that took place during the 112 day mission used speeds less than 256 kbps (kilobits or thousand bits per second), which was sufficient for collecting data to calibrate the instruments.
The Observation Plan
The two components of the LCROSS mission, the Centaur and the Shepherding Spacecraft (S-S/C), separated about 10 hours before they reached the moon. At the moment the Centaur impacted, the S-S/C was still 600 kilometers above the surface. Falling at 2.5 kilometers per second, the S-S/C reached the surface 4 minutes later. Observations of the Centaur impact event made during those 4 minutes were the purpose of the mission. Unlike orbital missions that can usually try multiple times to collect data, we had just one shot.
The diagram below shows the plan for observing from the S-S/C, starting one minute before Centaur impact, at the beginning of what we called “Sequence 2” in the NASA TV video. The diagram plots our intended schedule of instrument observations against time: each row represents one of the instruments (instrument abbreviations appear below each row of data), and each tick mark along a row represents one observation, either an image or a spectrum. Over some intervals, the observations are spaced so closely that the plot looks like a solid bar.
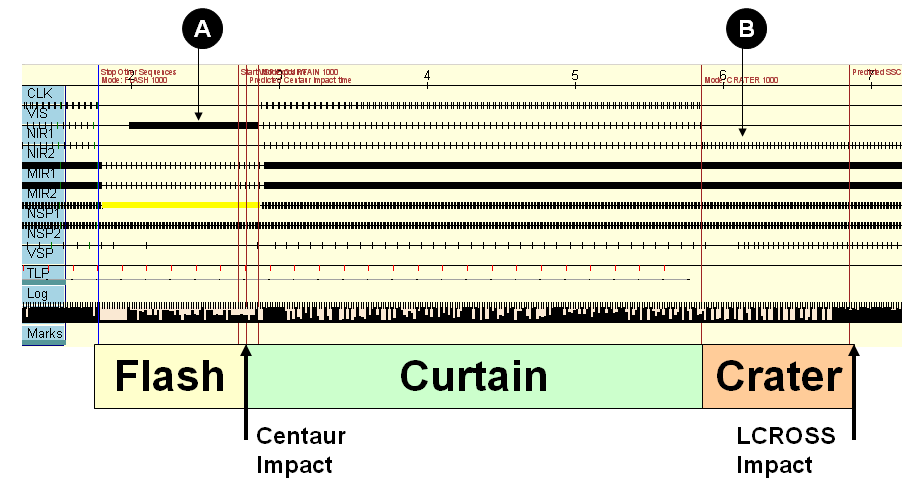
Figure 1 The LCROSS impact observation plan: These timelines indicate when each image and spectra was planned to occur during the final four minutes of the mission. The horizontal axis represents time. Each row represents an instrument, and each tick mark represents the timing of a sample (an image or spectrum) from that instrument.
The last four minutes were divided into three periods, called FLASH, CURTAIN and CRATER. Each period focused on a different aspect of the expected impact event and emphasized data collection from different instruments.
FLASH started one minute before the Centaur impact and focused on the very short burst of light generated by the Centaur impact itself. Starting from the top of the diagram, the plan was to stop both the Visible Light Camera (VIS) and the Near-Infrared Camera #2 (NIR2). This would allow us to focus on NIR1 images which we felt had the best chance of catching the location of the impact flash which we expected to be visible for less than one second. These three cameras shared a common input to our payload computer, called the Data Handling Unit (DHU), and could not be used simultaneously. By stopping VIS and NIR2, we could run NIR1 at a faster rate (see the segment labeled ‘A’), increasing the odds it would image the flash. The planned sequence also increased the NIR1 exposure time to capture the flash signature even if it was very faint. We knew this would produce a badly overexposed image of the illuminated lunar surface, but our goal was to locate the impact. We’d have plenty of other pictures of the surface. This sort of shifting attention between cameras accounts for the periods where one camera image would stop updating for a while.
We also designed the FLASH strategy for the spectrometers around our expectation of a dim, short duration flash event. Near Infrared Spectrometer #1 (NSP1), the main water-detection instrument, was put into a high-speed, low resolution mode (represented by the yellow bar). The Visible and Ultraviolet light Spectrometer (VSP) was commanded to take long exposures, and Total Luminescence Photometer (TLP) was powered early enough to reach equilibrium and be at its most sensitive for the flash event.
The second phase, CURTAIN, started just after the Centaur impact and ran for three minutes. Its purpose was to take spectra and images of the expanding vapor and dust clouds thrown up by the impact. CURTAIN was the most important period and also the simplest. All instruments ran in their default modes, as follows. The DHU shifted between the three analog cameras in a stuttering pattern – VIS, VIS, NIR1, NIR2 – repeating. Both thermal cameras monitored the plume shape and temperature. The two downward-facing spectrometers (NSP1 and VSP) looked for water and other chemicals. The side-looking spectrometer (NSP2) also looked for water and other compounds, but from sunlight scattered or absorbed by the dust and vapor cloud. The TLP continued to take data during this period, but it’s primarily function was during FLASH.
The goal of CRATER, the final period, was to image the crater made by the Centaur impact to get its precise location and, more importantly, its size. From its size and their detailed models of crater formation, the LCROSS Science Team can potentially tell us how the crater evolved over the few seconds of its formation and how much material was excavated. The primary instruments in this period were the two thermal cameras, MIR1 and MIR2. Their sample rates were increased relative to those for CURTAIN. To image the crater in a second frequency band, NIR2, the more sensitive near infrared camera, was commanded to its most sensitive setting. NIR1 and VIS would not be used during this period because neither was sensitive enough to see anything in the permanently shadowed area. All spectrometers would continue running to look for light reflected off of any plume or vapor cloud. At the end of this phase, the S-S/C would fall below the rim of Cabeus Crater, cutting off radio transmission to Earth, and then impact the surface a couple of seconds later.
There were three keys to making this plan work:
- Downlink Bandwidth: the data collected had to fit within the 1 megabit radio downlink. We did a lot of testing before launch to work out a data collection plan that was further confirmed and refined based on on-orbit performance. We gave priority to data from the most important instrument, the near-infrared spectrometers, to provide robustness to the design. The best scheme was pre-programmed and ready to go in case we were unable to command the spacecraft in the final hour.
- Camera Exposure: We had to change camera exposure settings during the descent to reflect the changing brightness of the impact event and the surrounding scene. Defaults were pre-programmed based on the latest lighting models for impact morning from NASA Goddard Space Flight Center.
- Command Timing: In the instrument command sequences governing FLASH, CURTAIN and CRATER periods, we had to orchestrate changes in instrument configuration as they were needed to focus on different aspects of the impact event. Sometimes these changes had to be interleaved with instrument data collection in a way that was vulnerable to small timing changes.
So What Actually Happened?
Well, as reflected in the recent LCROSS press briefing, we collected a very rich and interesting data set that met the needs of our science objectives. However, we had challenges in all three areas – bandwidth, exposure settings and timing – although all ultimately proved minor. However, in some ways, it was a close call. This diagram shows what data was actually collected during the final four minutes of the mission.
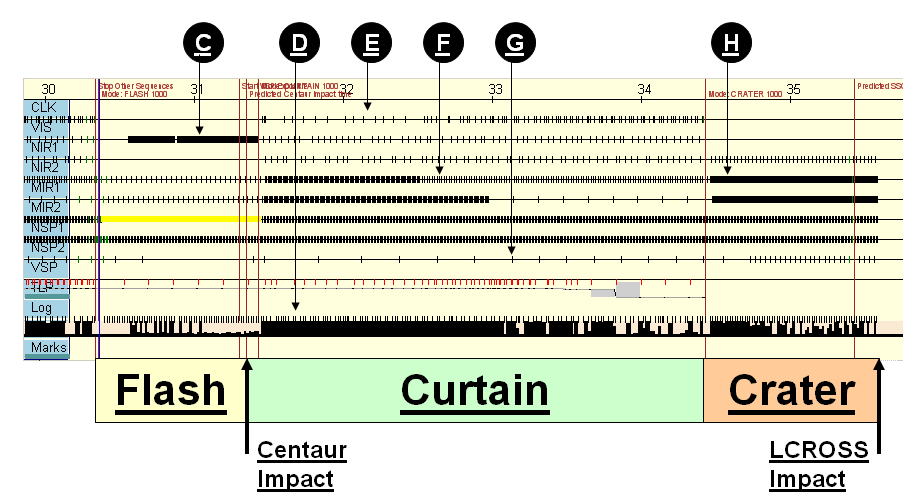
Figure 2 Actual performance of the LCROSS payload: These timelines indicate when the images and spectra were taken on the morning of the impact. The pattern gives clues about the performance of the hardware and software systems that collected the data.
First, the rows representing the spectrometers, NSP1, NSP2 and VSP, look almost exactly as they should. Except for one problem with the Visible and Ultraviolet light spectrometer (VSP), which I describe later, our plan for collecting spectra worked perfectly. This is very good, because the spectra carried most of the information we were trying to collect.
As for the cameras, several differences from the plan jump out. The most obvious is that the timing of observations along some timelines is irregular with many observations missing, e.g., the visible camera pointed to by note E. This occurred with all five cameras (the first five timelines) but not with the spectrometers (the next three timelines).
Scene Complexity and Bandwidth Limitations
Image compression is the process of finding and reducing redundancy in an image in order to transmit it more efficiently. On LCROSS, to fit within the 1 Mbps data rate limitation for our downlink, we used a lossy compression algorithm that typically reduced each image to 1/20th its original size. Lossy methods achieve greater compression than lossless methods by actually removing parts of each image. The algorithm tries to find subtle details whose removal the human eye won’t notice. Being able to combine many different kinds of data into a single digital data stream is so useful that this approach has been standard practice for many years.
In flight, the irregularity of observations occurred because we underestimated the complexity of the lunar scene during ground testing. We had done much of our testing with a large reproduction of the moon’s pole in front of the cameras, but it turned out this didn’t mimic the high contrast and detail of the real scene. Scene complexity mattered because the images were highly compressed and changes in the moon scene changed the sizes of the compressed images by a factor of 4. We first observed this behavior during the lunar swingby LCROSS performed during the first week of its mission. Turning on the instruments during the swingby was intended as a learning experience, and it proved critically important. It provided the best operational practice we got for the impact as well as data to calibrate the instruments.
After the lunar swingby in June, I changed the thermal camera sampling rates in the instrument command sequences for the final hour. Unfortunately, the compression problem turned out to be about 20% worse during the final hour of the mission than during the lunar swingby. This forced us to change the thermal camera rates again in real-time, but we had practiced changing them during rehearsals, just in case. In the NASA TV impact video sequence, you can hear the Science Team requesting a change of MIR1 rates to 1 Hz, and MIR2 to 0.1 Hz. See note F in the figure. The rate for thermal camera #1 (MIR1) changes just before this note and changes for MIR2 just after it. Even though we’d practiced, this was still a very tense time as we were losing some data while the changes were being made. Changing the MIR rates felt like it took forever.
The bandwidth problem could have been avoided if in addition to changing camera sampling rates in the command sequences, we had also changed the stuttering pattern for the analog cameras mentioned above to eliminate one VIS image during each repetition. However, our instrument simulator didn’t have the full set of instruments like the spacecraft, which made it impossible to adequately test this change on the ground. At one point, we discussed testing this change onboard before the impact, but lost the opportunity due to the fuel loss Paul described in his blog on October 4th (see “A Test of the Flight Team”).
One other problem caused by the complex lunar scene was damaged images. After compression, some of the visible camera images were still too large to fit within a single data packet for transmission to Earth. Here’s an example of the kind of damaged image that resulted. The shadowed area should be completely dark, but instead contains wispy bright areas. These compression-artifacts are intimately linked to the scene and need to be taken out with image post-processing.
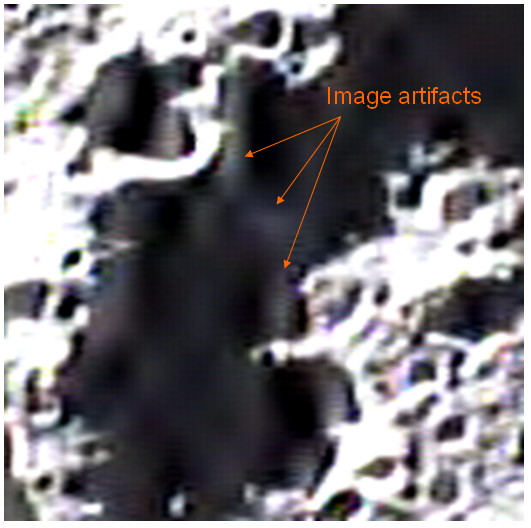
Figure 3 Example of damage to downlinked images due to clipping in the telemetry packet formatting software.
What caused these compression artifacts? I didn’t know it at the time, but the software for compressing these images had been written some years before to clip the compressed form of images to ensure they always fit within a single data packet (maximum size 65536 bytes). We used a wavelet-based compression algorithm, and clipping the compressed images removed some information needed to recreate the image accurately. The alternative would have been to split the images across multiple packets and reassemble them on the ground. This certainly could have been done in principle, but doing so would have introduced significant changes right at the heart of software that we had planned to reuse without change after its successful use on previous projects. With what we know now, changing this would have been justified, but it would also have been risky given how central image compression was to the overall design. With what we knew at the time, I believe we would have left it alone because of our short development schedule and all the other things that had to work.
November, November!
Most of the commanding we did from the ground was to adjust the exposure times of the near infrared cameras as the scene changed. The other cameras either controlled themselves (VIS) or had only one appropriate setting (the thermal cameras, MIR1 and MIR2). We controlled the exposure setting for the near infrared cameras explicitly because we were trying to image a relatively dim flash and ejecta curtain close to bright mountain peaks.
Near the beginning of the FLASH period, we discovered we didn’t get this balance right. To image the dim centaur impact flash, we deliberately overexposed the sunlit peaks. This setting combined with the Cabeus scene overdid it. The sunlit areas electronically bled into nearby parts of the image. That occurs when electrons in overexposed pixels move across the image detector to other pixels. In this case, the shadowed area of Cabeus crater was completely covered, obscuring our view of the impact. That was why the only image that was updating just before the Centaur impact was white. We hadn’t seen this level of bleeding earlier in the mission, or in almost any of our testing. However, after searching through our data archive, I realize now we did see it occur once, two years ago, in one flashlight test in a darkened room but did not fully comprehend the implications.
The FLASH period was designed to start 1 minute before the Centaur impact, so we had a little time to recover once we saw the problem. During this minute, our first priority was to confirm that the spectrometers (NSP1 and VSP) and photometer (TLP) were working properly. Once that was done, we focused on the NIR1. Since we still had commanding during this period, we tried to change the exposure setting (Payload Scientist Kim Ennico called out “Flight, this is Science, please change NIR1 to OPR 9, over.”). We had less than 30 seconds to get this command sent up to the spacecraft. The command was actually sent but arrived a few seconds too late to capture the impact. In hindsight, this was a challenging stretch for the camera’s range, due to the scene and the potential for bleeding. Our strategy – to aim for the most sensitive exposure setting followed by one attempt to back-off depending on the data-might have worked had we been looking at another region of the moon, that is, had, we launched (and impacted) on a different date, where the terrain and lighting would have been different. While all this was going on, the impact flash was captured by NSP1, so the key science measurement was made.
We intentionally caused the same issue later, during the CRATER period, but we had better success (see above figure at the segment labeled ‘B’). Initially, the NIR2 camera images were badly overexposed for the same reason as during FLASH (hence the white images that appear in the NASA TV video just after entry to DV Mode). Kim Ennico, the Payload Scientist, made the call to reduce the exposure time slightly, from what we called OPR 15 to OPR 10. (Again, you can hear this request over the voice loop in the NASA TV video.) She was using live-information from the NSP1 spectrometer and checking those values in real time against a spreadsheet near her seat. You can see her checking and rechecking on the video before making the choice. We only had only one chance to choose the right one. The command was sent and received 30 seconds before the S-S/C’s impact. Kim’s call initially left the images overexposed, but as the lit peaks slid out of the field of view, her choice produced excellent images of the very dark crater floor, including the image that gave us our best estimate of the Centaur crater size. These images go all the way down to 2 seconds before S-S/C impact where the craft was 5 kilometers above the surface. The crater floor of Cabeus was indeed brighter than any of the predictions, at least in the infrared. That’s another reminder of science and exploration. Sometimes you are surprised as you collect new data, especially data from areas never looked at before.
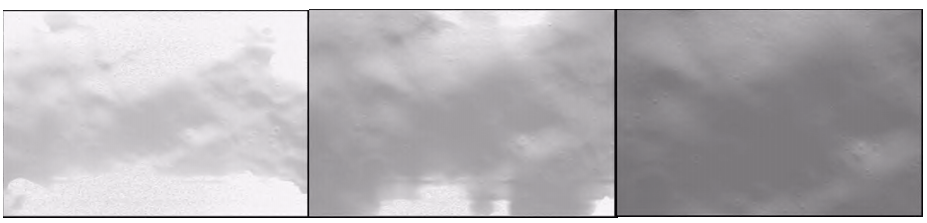
Figure 4 This image sequence was captured just before the end of the mission and shows the NIR2 camera going from badly overexposed to acceptably exposed as the lit peaks surrounding Cabeus leave the field of view.
How do we know that’s the Centaur crater? Because it was also seen by the two thermal cameras (MIR1 and MIR2) while it was still warm, and we can overlay the images. The left figure below shows aligned images from NIR2 and MIR1, taken before the Centaur impact. The figure on the right shows aligned images from these cameras taken just before the S-S/C impacted and showing the Centaur impact crater (see inset). These images don’t align perfectly because they were taken about a second and 2.5 kilometers apart. To obtain images of the Centaur crater using three different cameras was our goal, and we succeeded.
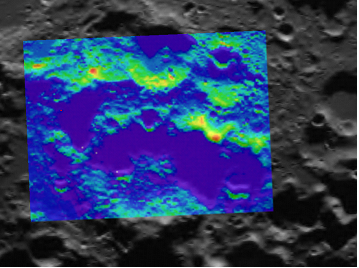
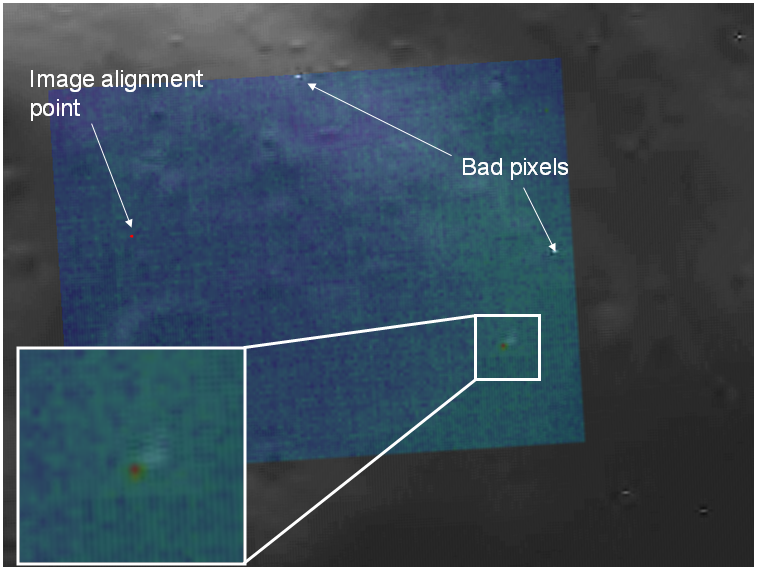
Figure 5 The bottom image shows the Centaur impact crater in both near-infrared and mid-infrared images. The top image overlays images taken before the impact by the same two cameras.
Kim’s call of “NIR2 to OPR 10″ yielded a great image of the Centaur crater, but it also caused some confusion. The name for Near-Infrared Camera #2 (NIR2) was too similar to the name of Mid-Infrared Camera #2 (MIR2). We had practiced this interaction over our voice communication loops, but we hadn’t practiced it enough to do it quickly and perfectly under time pressure. Kim had to repeat her call using the phonetic term ‘November’ for the ‘N’ at the beginning of NIR2 (during CURTAIN phase in the NASA TV video, you can hear the Flight Controller, Jim Strong, ask “is that ‘November’ or ‘Mike’?”, referring to NIR2 or MIR2, ). We didn’t realize when we picked the obvious names for these cameras three years ago that the names could cause confusion when spoken over the voice loops connecting our mission control rooms. Back then, our plan avoided real-time commanding completely, but as we learned through our practice sessions before launch and actual experience after launch, we realized we needed the flexibility. We retrofitted a process for proposing and confirming real-time commands into our mission operations architecture as best we could given the facility and time constraints. Note that we didn’t consider doing this for maneuvering the spacecraft or for the most critical science instruments, only the secondary instruments.
Command Timing
The commanding side of the automatic sequence ran almost perfectly. We did have one problem with the Visible and Ultraviolet Spectrometer during the CURTAIN period, though. Because the instrument data handling unit (DHU) was at its maximum data throughput capacity during the first part of CURTAIN, one command to change exposure time was delayed and sent during a period when the instrument wasn’t listening. That command was ignored. This resulted in capturing fewer spectra with longer-than-planned exposure times. Luckily, the longer exposure times turned out to be a blessing, since the ejecta curtain was much fainter than some models predicted. The loss of more frequent sampling due to the longer exposures did not affect the science measurement.
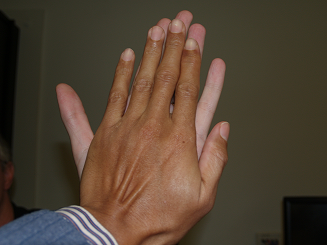
High Five Fail
Yes, I should have. After the end of the mission, I missed a high five that was captured on camera. I was teased about it by my colleagues that morning and by my kids that night. The other operator involved, our Telemetry Data Manager, known as “Data” over the voice loop, is both a good colleague and a friend. I didn’t intend to embarrass him and have since apologized. We had been told to avoid high fives to prevent exactly the sort of mistake I made, but once the hand went up, I should have responded. So, here it is, for the record:
Why didn’t I respond? I honestly don’t remember the moment clearly, but I did have two things on my mind. First, my job at that point was to move to the Science Operations Center (SOC) to prepare for the post-impact press conference. We had two hours to make sure we’d gotten the data we expected, to prepare presentation charts and to look for anything obvious. I was concerned about that because I had missed seeing the plume we had hoped for like most everyone else.
More importantly, I was really stressed out. The DHU, the computer that processed all instrument data, was struggling with the very large packet sizes of visible camera images, and the DHU almost crashed a number of times during that final hour. We had developed and practiced a procedure to recover from such a crash to prevent a substantial loss of science data. Flying a spacecraft is a group effort with lots of cross-checking, and as the Payload Software Lead, I felt especially responsible.
During payload development testing, we found and fixed several problems that would have been problematic for the payload. This problem which led to potential crashes of the DHU was known and was the most difficult software problem we saw. The root of the problem was a small chip that controlled the data bus connecting the video capture and compression chips to each other and to the main processor within the DHU. Under certain circumstances this bus controller chip would stop responding, and the DHU software would crash. Since we didn’t have access to the chip’s design to understand why it would stop, and we didn’t have time to replace it, our approach was to create a method for quickly recovering on orbit. This method had two parts. The first part was a software patch we developed that reset the bus controller when the DHU’s main processor noticed it had stopped responding. The second part was a procedure for quickly rebooting the whole DHU from the ground if the software patch didn’t catch the problem.
We developed and tested the software patch just a few weeks before the payload was shipped to Southern California for integration with the rest of the spacecraft. From that point on, through the rest of our testing on the ground and in orbit, we didn’t see this problem again. That is, we didn’t see it until the morning of the impact. That morning, the patch needed to reset the bus controller two dozen times. The vertical green lines in this figure show when.
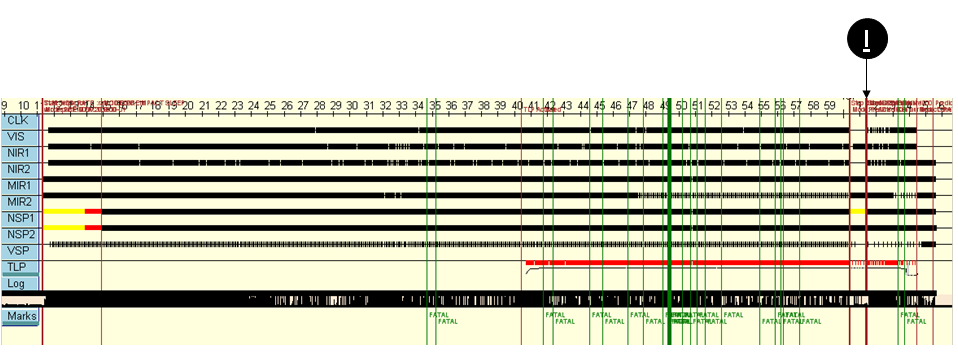
Figure 6 During the final hour of the mission, Data Handling Unit (DHU) software detected and corrected an anomalous condition on a bus controller chip multiple times. The green lines show when these events occurred. The right end of this figure, starting at the label ‘I’ (the time of Centaur impact) corresponds to the time spans of the planned (Figure 1) and actual (Figure 2) performance plots. Earlier events happened while monitoring payload performance in the 56 minutes prior to Centaur impact.
Once these events started, I was prepared, on a hair trigger, to start the process of rebooting the DHU if the patch didn’t work. I was constantly checking and rechecking the fault response procedure I had developed for our payload. The details of this procedure varied over time. As the on-board sequence progressed and we got closer and closer to the Centaur impact, we had different decisions to make to recover if something went wrong. This strategizing was being done over another voice loop with Kim and Tony Colaprete, the LCROSS Principal Investigator, in the Science Operations Center (SOC) which was not audible to the audience watching on NASA TV. We had to keep track of a lot of independent data threads and contingencies simultaneously. Our actual trigger for starting this recovery, a gap in numeric sequence of the data coming from the instruments, even occurred once, but it was unrelated and didn’t need a response. In the end, our defenses worked. The software patch performed exactly as intended and no crash occurred. After the S-S/C impact, I breathed a sigh of relief and moved to the next room to start preparing for the press conference.
Final Thoughts
As I said above, we had challenges in all three areas critical to making our plan work: downlink bandwidth, camera exposure, and command timing. Ultimately, all of the problems we had proved minor, and we collected the data we needed to draw conclusions about the presence or absence of water and other substances in Cabeus crater.
We at NASA all too often strive to give the impression that complex, difficult missions are routine. They’re not. They’re complex and difficult. What makes them possible is long planning, teamwork, and careful review by people both inside and outside the project. One name for this process is “Systems Management”, which recognizes that people need backup just like the parts of a complex machine. I personally made some mistakes and caught some mistakes. Together, we caught enough of them that we were successful. For me, it was a huge privilege and a wonderful experience. I’m very grateful to have been a part of this mission.