Category Archives: Science

Using the waiting time wisely to make the best use of the remaining ops ahead

Reposted from https://blogs.nasa.gov/mission-ames/2013/05/22/post_1369242690470/.

Line ops last night were cancelled due to a “no-go” by the telescope assembly subsystem. A problem had been found that could not enable observations tonight. It was a call the science team did not want to hear, but it was the right call. This exercised the reason why there is a “readiness review” before going out to execute a complex activity. A plan was put in place for the 1st shift when they get in at 7am (0700h) today (Wed) to address the problem and report back during the day. If all goes well, a crew-briefing will be scheduled again at 2130h tonight and we can resume line ops at 2300h.

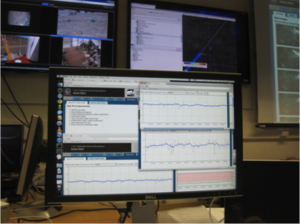
If we were observing using a ground-based telescope, we watch the weather. A seasoned ground-based observer watches the humidity. You can often get obsessed looking at trends in pressure, temperature, etc. It’s important as you may need to replan your allotted observation time if you lose a night  (or nights) to the weather-gods.When I assisted with a balloon launch last summer at Ft. Sumner, NM, we’d gather daily to address the winds. Winds were most stable at dawn so we’d have our “crew briefing” at 3 or 4am with readiness to roll out at 5am with the hope to launch in the next hour or so (it would take nearly an hour to do the roll-out of the balloon and the He fill). Yes, sometimes the call would be made at 3am for a “no-go” or even as late as right before the fill. And then you roll back the balloon to the hangar. Last Sept, we launched on the 3rd attempt. All rocket launches also watch the weather and have various sub-system “go/no-go” checks.

SOFIA ops are not so different from those other examples.

So, we replan again. We have three remaining nights left in the schedule, two this week and one contingency night next week, which now seems to be required. Also, we’ve started looking at the flights scheduled for next week, to see what tests planned in flight would supersede the line ops tests to allow to compress our “line ops” schedule. Now, this is a calculated risk since the purpose of line ops is to test the system end-to-end before flight. So essentially you want to run the key components you plan to test inflight on the ground first.

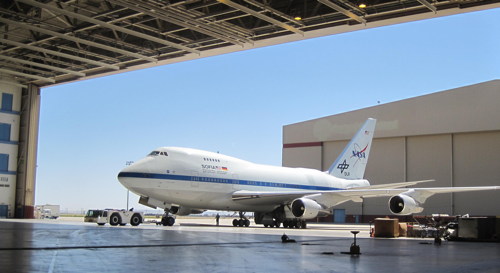
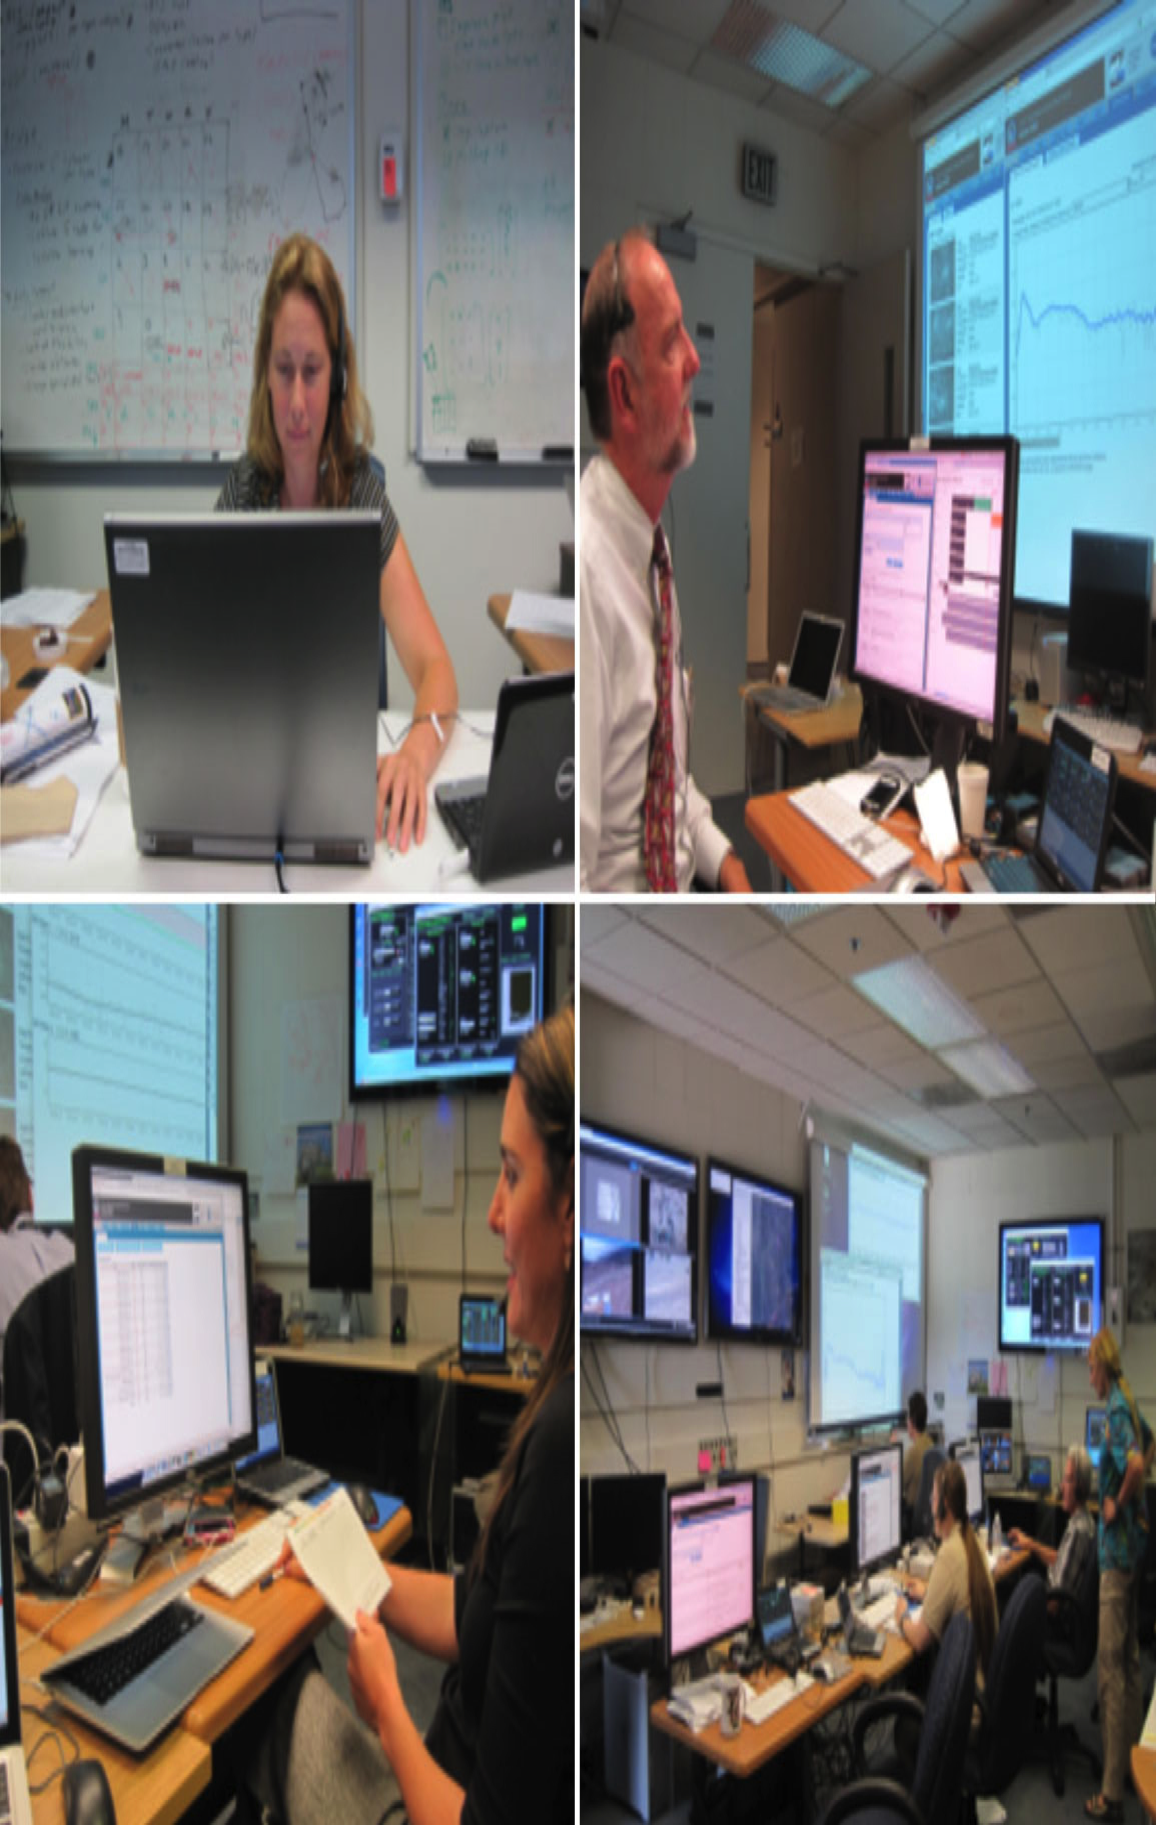
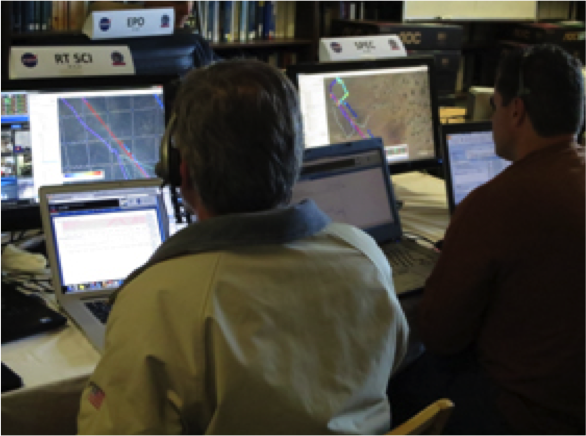
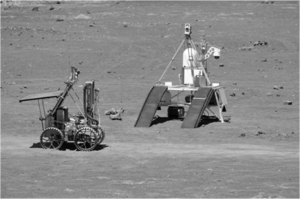
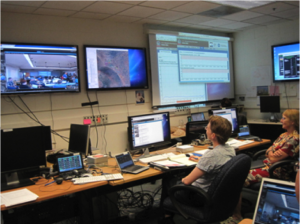
What are line ops anyway? It’s not as “dramatic” as the actual flight, but it serves very important purposes to follow our observation plan end-to-end, address timing issues, and most importantly, communication between people and communication between people & machines. The plane is towed out on the runway to a viewing position safe from any active runway traffic, and preferably in a location far from buildings or lights to obstruct viewing angles.We operate on plane-provided power. We command the telescope door to open,configure the telescope, check it out, power the science instrument, and start running through a series of discrete tests, some of which are to be run exactly on the flights, and other diagnostic tests that are needed that would otherwise take up the valuable flight time.

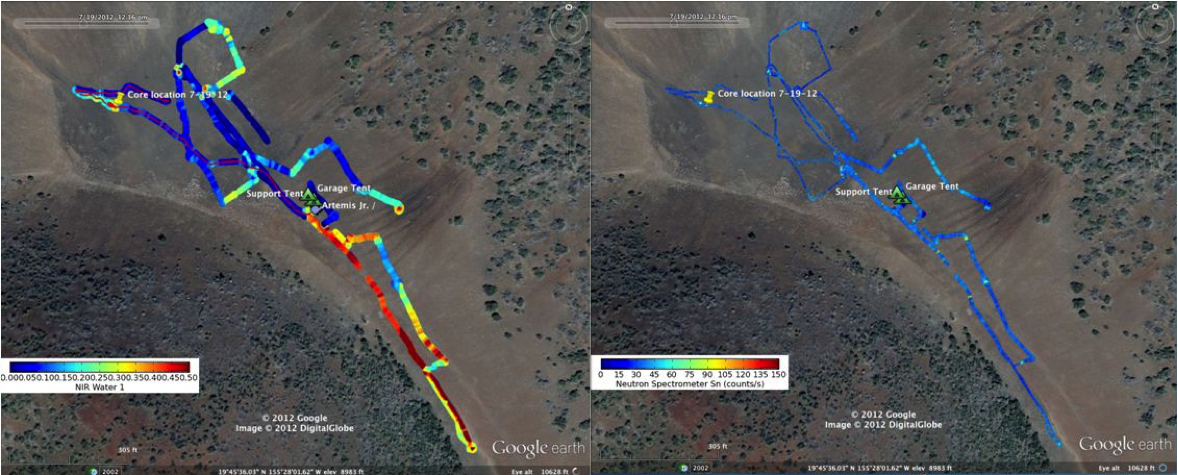
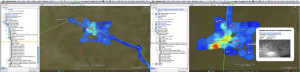
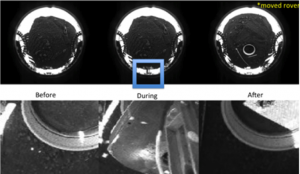
One of the tests we want to do is test the “nod” function of the telescope and how the data sets we collect affect our observing strategy optimization (ahem, improve signal to noise). In mid-IR astronomy, the sky background is “brighter” than our targets. In fact, we often cannot see our targets in the original raw data until we do a “background subtraction.” So we use the telescope’s secondary mirror to “chop” a source back & forth (as it would appear on our detector) at a fast rate. And then we would command the telescope to “nod” to a different part of the sky. And repeat the process of“chopping” and “nodding” over a pre-planned orientation, both “throw distance”and “angle.”

You can read more about Chopping at Nodding at Why Chopping & Nodding is needed for SOFIA FORCAST Observations.

An example taken from PDF on Signal to Noise Improvement by Chop/Nods sums it up nicely.

example_forcast_chop_nod_images
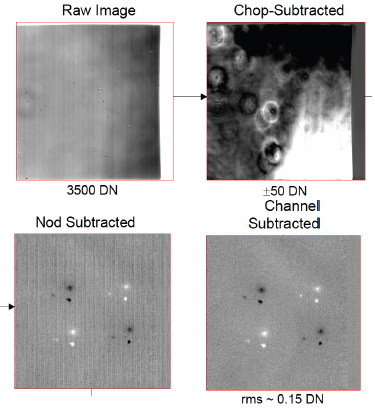
So we’ll be exercising things like this during the line ops, exploring the same technique for different roll angles because when it comes to your science target which can be anywhere in the sky, we’d like to understand the system performance and, if any, limitations.

We have other tests planned like assessing the detector bias performance, looking at flexure of our alignment, particular for our grism mode where we have narrow slits, optimizing a new flat field technique, and running through the science scripts to checking for timing and fix any commanding errors.

So fingers crossed, we will get on sky tonight, on the tarmac at Palmdale, CA. The skies have been clear the last two nights, so we the weather gods have been kind. We now need the electrical-power-subsystem gods to be kind.

Firm Flexibility

Reposted from https://blogs.nasa.gov/mission-ames/2013/05/21/post_1369126163898/.

Tonight’s line operations were cancelled due to open issues recertifying work on reworked parts of the telescope assembly (TA) power subsystem. There are no show-stoppers, just the need for more time for testing and integration. Progress continues to be made. The cautious step was to make the decision to start line ops tomorrow, and there is a contingency day next week to make up time if needed. The schedule for the remaining three nights of line ops will remain tight, but there is a plan. Creative re-ordering of tasks will be the “philosophy” these next three days. Having worked operations on two space missions, I can say that operations of any craft, air or space, is a skill of “firm flexibility.”

This evening, I experienced a Technical Readiness Review(TRR). This consisted of getting all the leads around a table and walking through the status of each subsystem, who is needed where and when, what types of testing will be done during the next few days, and when the daily crew briefings will be held. Also addressed were questions posed by the visiting science team to the operations team, to fill in some gaps. Today was the first time the group had re-assembled since the last line & flight ops, which for the FORCAST instrument, had been back in March. Since then, two other instruments (HIPO/FLITECAM and GREAT) had been installed, tested, and removed,and there have been software upgrades to both the telescope and telescope to science instrument communications. This phase of operations is pretty complex,folding in highly dynamic items that may seem be changing a lot, but it’s actually normal. And the job of operations is to keep to schedule while still achieving the tasks. Sometimes the path is different from the exact original concept, but if the goals are met, it was a successful journey. At tomorrow’s crew briefing at 2130h, open items from today’s TRR will be addressed and closed before line ops begins, set for 2300h-0500h.

I’m still a bit on the sidelines, watching and learning from the experienced SOFIA observers who have worked with SOFIA operations before. During a lull this afternoon, I got a glimpse into the AORs, or AstronomicalObservation Requests, which is how an end-user communicates her requests to enable an observing plan via scripted observational tasks. The AORs for our upcoming line ops have been written, and one of my roles will be quick look data analysis to confirm they executed as expected. My colleague Luke Keller, from Ithaca College, is shown below crafting some new slit-stepping observations.

Oh, I got to step inside SOFIA today. She’s bigger on the inside (compared to what I had expected, that is.).IF

Being in the presence of a cool lady, a 747SP named the Clipper Lindbergh

Reposted from https://blogs.nasa.gov/mission-ames/2013/05/20/post_1369084870713/.

I have arrived here in Palmdale, CA. This is a new place for me, so it has a share of expectations. Palmdale, just 50 miles north-east-ish of Los Angeles is home to the Dryden Aircraft Operations Facility or DAOF, for short.  Upon arrival, I learned that NASADryden Flight Research Center itself is about another 40 minute drive away, so time permitting, I’d like to check out that sister center.

I’ve rendezvoused with two colleagues from Cornell and Ithaca College who have both flown on SOFIA and also have put in so many hours to make the FORCAST instrument a success. They are eager to get back to operations & science observations again. I’ve also met two graduate students, one who has flown already and another, just as green-as-me, this being his first time to Palmdale and checking out the *Stratospheric Observatory for Infrared Astronomy* for himself.

Today marks a special occasion for me to see SOFIA in all her shiny-white-paint with an organized crew getting her ready for this week of line operations, or line ops. The reality is intense. One can read about things on the internet or in papers, but to actually see the physical metal, glimpse at her sleek curves, observe the crews keeping her safe and airworthy, is something else. And that’s just the outside.

The science instrument FORCAST, a mid-infrared instrument, is already installed and had its latest cryogen fill this morning.

Tonight, line operations are scheduled from 11pm-5am and I can share what I learn.  Until then, pieces of the complex set of what goes into operating a facility such as SOFIA,are slowly coming into place.

For now, I just cannot help staring at this amazing beauty.

IF

747SP, the SP means “Special Performance.”

Demonstrating Science: From the Ames Research Center Science Back Room

Reposted from  https://blogs.nasa.gov/analogsfieldtesting/2012/07/31/post_1343767437112/ and https://blogs.nasa.gov/mission-ames/2012/08/31/post_1343858990664/.

Ames scientist Kimberly Ennico wrote this blog entry on July 20, 2012 while working on a field test for RESOLVE, the Regolith and Environment Science and Oxygen and Lunar Volatile Extraction. 

43rd anniversary of “One small step, One giant leap”

I write this after the conclusion of our multi-day field demo of the RESOLVE payload. Prior to any activity, as with all organized operational tests, a clear set of success criteria is identified. RESOLVE, having being defined by NASA’s exploration and technology divisions, has the following goals:

CAT 1 Objectives (Mandatory):

  1. Travel at least 100m on-site to map the horizontal distribution of volatiles

CAT 2 Objectives (Highly Desirable):

  1. Perform at least 1 coring operation.  Process all regolith in the drill system acquired during the coring operation
  2. Perform at least 1 water droplet demo during volatile analysis.

CAT 3 Objectives (Desirable):

  1. Map the horizontal distribution of volatiles over a point to point distance of 500m.

            * Surface exploration objective is 1km

  1. Perform coring operations and process regolith at a minimum of 3 locations.
  2. Volatile analysis will be performed on at least 4 segments from each core to achieve a vertical resolution of 25cm or better.
  3. Perform a minimum of 3 augering (drilling) operations

            * Surface exploration objective is 6 augers

  1. Perform at least 2 total water droplet demos.  Perform 1 in conjunction with hydrogen reduction and perform 1 during low temperature volatile analysis.

CAT 4 Objectives (Goals):

  1. Perform 2 coring operations separated by at least 500m straight line distance

            * Surface exploration is 1km

  1. Travel 3km total regardless of direction
  2. Travel directly to local areas of interest associated with possible retention of hydrogen
  3. Process regolith from 5 cores
  4. Perform hardware activities that can be used to further develop surface exploration technologies

At first glance, they are pretty much very operations based: 100 m (328 ft) here, 1 km (3,281 ft) there, three locations, three auger (drilling) ops, etc. They were the driving forces of this demo, no pun intended. Our main focus was to demonstrate the technology and the operations. However, as each day went on, you could hear on the voice loop the engineers asking more and more about what we scientists – those on site or in our “Ames science backroom” – were discussing and observing with each new scan, spectra, and image. Also, we actually found ourselves demonstrating science in this activity. That was the whole beauty of this project: science enabling exploration and exploration enabling science. Each team member, excited about roles played by others, united by our shared excitement in the concept of pushing our ability to explore beyond our home planet.

At the end of our field demo, we clocked 1,140 m (3,740 ft.) total in-simulation roving distance, 475 m (1,558 ft.) separation travel distance between hot spots, with total separation of traverses greater than 500 m. (1,640 ft.) We located nine hot spots, completed four auger operations, four drill operations, and four core segment transfers to the crucible (oven) for volatile analysis and characterization. We had seven remote operations centers plugged in to our central system. We logged 185,918 rover positions, collected 227,880 near-infrared spectra, 136,273 neutron spectrometer measurements, 139,703 drill measurements, 3,630 image data products, and wrote 2,446 console log entries.

banddepth_resolve_2012

Band-depth (a measurement of abundance) for a water band (at 1.5 microns) plotted for the whole simulation. Most of the water detected this way turned out to be “grass” in the spectrometer’s field of view, but we did rove over some pretty “dry areas.” Variety indeed. The red line shows our traverse path on July 19. (Right) Counts for the neutron spectrometer for the simulation. This aerial photo shows how we traversed over a range of geological features, a mixture of glacial (old outwash) and volcanic (olivine basalt) deposits. Image credit: NASA

While some of the ISRU technology demonstrations focused on pre-arranged drill tubes filled with pre-planned test materials, we were particularly excited to drill into the native tephra. Its saturated soil (up to 20%) is more consistent with the Mars surface rather than the lunar surface. If successful, this test also would show practical drill performance parameters for future Mars drill missions. The approved procedures allowed us to core down to a maximum of 50 cm (19.6 inches). We reached 45 cm in about 56 minutes. Then, instead of putting the sample into the oven, the core tube was “tapped” out onto the surface while the rover moved forward to lay out the sample for evaluation by the near infrared and neutron spectrometers. This was a new procedure developed jointly by the rover, drill, and science teams, which demonstrated a new way of extracting material and quickly evaluating it.

artemisjr_resolve_2012

Artemis Jr rover DESTIN (drill) acquiring sample from native soil. Image credit: NASA

operations_resolve_2012

The Ames science backroom team, clockwise from top left: Erin Fritzler, project manager; Bob McMurray, system engineer; Kayla La France, intern; Ted Roush, scientist; Carol Stoker standing, scientist; and Jen Heldmann, scientist. Not shown: Stephanie Morse, system engineer; Josh Benton, electrical engineer; and me – Kim Ennico, scientist. With our team of nine people we staffed three consoles in two shifts, for eight-days.

elphic_colaprete_resolve_2012

Ames science team members in Hawaii. They were our main interface for the Ames backroom to the Flight, Rover and Drill teams, whose leads were in Hawaii, but whose support teams were at KSC in Florida, JSC in Texas, and CSA in Canada. Left to right: Rick Elphic, Real Time Science and Tony Colaprete, Spec. Photo by Matt Deans.

To end on a fun note: mid-way through the sim, I got my updated console request so I could monitor the neutron spectrometer and near infrared spectrometer simultaneously to look for correlations (this combination of techniques had never been done before). I spotted this one (image below) as we were roving about. Camera imagery had been down, so we were “in the dark” from visual clues. Upon seeing the two signals, I called out a strong hydrogen and water signal to the Science team in Hawaii over the voice loop.

myconsolescreens_resolve_2012

Screengrab of one of my console screens. Top trace is the neutron spectrometer Sn counts showing a modest signal. Bottom traces are two different near-infrared water spectral regions that showed changes at the same time.

And it turns out we roved over this, a trench of water and a piece of aluminum foil reflecting the clear blue Hawaiian skies. The neutron spectrometer is designed to detect hydrogen at depth, whereas our near infrared spectrometer is more suited for surface water.

testtarget_resolve_2012

A test target along traverse path for July 19. Image credit: NASA

This target, like others we traversed over the past week (buried pieces of plastic, netting, etc.) had been dug out in the wee hours of the morning by other members of the RESOLVE operations team. Good way to get a few hours exercise after being cooped up behind monitors!

So what’s next? A “lessons learned” exercise is called out for next week. The different teams wrote down our learning points daily when they were fresh in our minds. We will review them as a team and move forward with the next steps – building a version that works in a vacuum. And our Ames backroom science team has identified a few science papers to write. We are excited!

For more information about the In-Situ Resource Utilization analog field test and the RESOLVE experiment package, visit www.nasa.gov/exploration/analogs/isru


Iterations of Science & Exploration

Reposted from https://blogs.nasa.gov/mission-ames/2012/07/19/post_1342737399087/.

Ames scientist Kimberly Ennico wrote this blog entry on July 16, 2012 while working on a field test for RESOLVE, the Regolith and Environment Science and Oxygen and Lunar Volatile Extraction. This week you can follow RESOLVE live on Ustream [Note: link was active in 2012].

On this 43rd anniversary of Apollo 11 launch, the moon is on my mind, naturally.

I am a NASA scientist who typically spends days in the office staring at my computer screen, “crunching” data, making plots, analyzing the results and writing up what is being demonstrated by the completed experiment. You know, that scientific method. The experiment could be an observing run at an observatory, a lab-based test or a series of images taken by a space telescope (at some past date) that is sent down to the ground or retrieved from a data archive. Quite frankly, I am often a passive (but always strongly passionate) participant in the advancement of science.

This week, I found myself in the rare moments where I am contributing to the operations of a space mission. In this case, it was a field demonstration of a future lunar rover. For full disclosure, in 2009 I also got the chance to participate in a real space mission with LCROSS, which was an amazing experience. This “field demo” experience is slightly different and provided me with an opportunity to reflect on the power and honest “truth of iteration” and how valuable it is for learning.

First, I need to set the stage. We are now in day four of a seven-day “field demo” of the RESOLVE payload. RESOLVE stands for Regolith and Environment Science & Oxygen and Lunar Volatiles Extraction. Snazzy name, eh? It is a payload designed to be on a movable platform on the moon. Its objectives are to locate areas of high-hydrogen, which is an indicator of possible water ice in the subsurface. After identifying a “hot spot” the rover is commanded to stop and begin initial “augering” with active monitoring for water and other molecular signatures. The augering process takes about an hour and samples down to about 30-50 centimeters (to give us a sneak-peak of what lies beneath). It can drill deeper, but the amount of subsurface material brought up is expected to be limited. If we find something interesting, the drill is put into place to drill down 1 meter, the limit of our initial surface detection methods, and extract “core samples” from a series of depths. Finally, the last leg of this “roving laboratory” is to take each of the “core samples” and place it inside an oven where it is heated to liberate the molecules. To identify what is in the sample, the vapors are collected by a mass spectrometer and gas chromatograph. It is essentially a mini-lab, very similar in approach to the Mars Science Laboratory currently en route to the Red Planet.

resolve_artemisjr_2012

Right: The RESOLVE payload on the Artemis Jr. rover (left) and mock-lander (right) during a field demo exercise in Hawaii (Photo from RESOLVE team).

Why are we doing this? Well, not only has LCROSS data indicated the presence of water on the moon, but datasets from NASA’s Lunar Reconnaissance Orbiter, Lunar Prospector, Cassini, Deep Impact and Clementine also point to “significant quantities” of hydrogen-bearing molecules, particularly in permanently shadowed craters near the lunar poles. The form of the hydrogen is widely debated, so there is a need for “ground-truthing.” Lets dig and sample that dirt! At the same time, these hydrogen-bearing molecules could also be extremely useful resources for water, propellant, etc. So in comes a trendy-buzz word in space circles, ISRU, which stands for In-Situ Resource Utilization.  Historically when explorers reached new lands on our planet, if you could “live off the land” using items that you found along the way, you considerably extended your exploration journeys because you have to carry everything with you (not to mention the related expenses). Hunting and gathering for food, making shelters from forests, mining local fossil fuels, etc. As we journey to other worlds, we can do the same.

Enter analog-missions. We’re using Hawaii for the moon. Sadly I am not there (my scuba diving urges will just need to wait). I am sitting in the “Science Backroom” here at NASA’s Ames Research Center in Moffett Field, Calif. It is basically a room full of desks, with lots of computers and monitors and headsets to hear audio loops.

sciencebackroom_resolve_2012

Right: Me (left) and Carol Stoker, drill expert and Mars scientist, in the Ames Science Backroom looking over activities. Image credit: Jen Heldmann

Analog missions have been performed for years to validate architecture concepts, conduct technology demonstrations and gain a deeper understanding of system-wide technical and operational challenges. And let me say, on day four, it is doing exactly that. A lot of stops and gos, lots of “oh I wish I could see this or that,” etc. etc.

We have a distributed team, and this is not uncommon for most operations activity. Some are in Hawaii to assist with physical items associated with the rover and payload. At a nearby building in Hawaii, others have access to real-time data for monitoring and control. Supporting control centers are in place in Texas (NASA’s Johnson Space Center in Houston) and Florida (NASA’s Kennedy Space Center), while in California (here at Ames), others support the mission science with access to high-tech visualization tools. We all have our respective roles, but we need to work as an integrated team to achieve success. At the same time, “not all should speak at once” otherwise you talk past each other and you can miss things. So there is a bit of needed protocol at work. In our “science backroom” we talk with our on-site science reps Tony Colaprete & Rick Elphic who are actively monitoring the flight and rover voice-loops, which we may not always be listening in on. Our purpose is to focus on real-time and archival science analysis, because, when you come right down to it, we are exploring. We don’t know what we will find next.

This mission concept also is relying on humans to make decisions at critical junctions, so it is far from being an autonomous machine. And by involving people, you can run into some pretty interesting decision points. We are also test driving (pardon the pun) a new way to integrate our visualization of our data. We have the “typical” live telemetry from the instruments on the rover and their trends. But we are also overlaying in near-real time the instruments’ data and rover position onto a Google map. We are taking advantage of an existing data visualization tool and its properties (layers, grids, pin locations, commentary, etc.). And we are linking the photos from the on-board rover cameras to the Google maps just like people do with their holiday pictures. It is actually rather elegant, but also needs some tweaks.

track_resolve_2012

Above: (Left) Screengrab of one of our visualization tools of a traverse-trek with data from the neutron spectrometer colorized to indicate signal strength. The green line shows the planned path; red line shows the actual path. Shown here is the trace from a “hotspot localization” routine so we can pinpoint the source further for analysis. (Right) Same scene but this time overlaid are locations of each of our rover-camera images, with one shown as an example.

drillingexample_resolve_2012

Right: Examples of rover images before, during, and after a drilling exercise from (top) a fish-eye lens camera in the rover underbelly and (bottom) a camera that is coincident with the near infrared spectrometer field of view.

We are learning as we go. Each day we have a series of tasks to complete whether it is a number of meters to traverse, or completing the drilling of multiple sites, etc. Timeline is extremely important since in a real flight mission; there will always be limited items such as fuel or power. Roving plans are decided ahead of time, but things do not always go according to plan, especially if something we did not expect appears on our data streams or the rover does something unexpected on unexplored terrain. With each unexpected event, we learn.

My personal challenge is keeping up with all the conversations going on, those that address what we are seeing real-time, those that are focused on how we can improve our approach and those all about the real thing — when we do this on the moon.

nirviss_resolve_2012

Right: This was my monitor today as I was trying out a new method to look for a water signature, monitoring any correlation between the neutron spectrometer signal and various band depths from the near infrared spectrometer. My requests for a new visualization tool are being incorporated into the system and will be ready for me when I go on console tomorrow.