Test and Calibrate DHT22 Hygrometers
Page Contents
Introduction
This page covers tests of the DHT22 / AM2302 and description of the test methodology. For other types of devices, see the index of all my hygrometer testing.
The DHT22 (a.k.a. AM2302, RHT03) is a popular hygrometer/thermometer in the hobbyist electronics community. It is cheap, easy to use and the specification claims good precision and accuracy. There are several different data sheets floating around the web for what appear to all be the same device, though I cannot be sure they are all from the same factory. Typical advertised specs for AM2302/DHT22 are:
| Absolute accuracy | ±2% |
| Repeatability | ±1% |
| Long term stability | ±0.5% per year |
I searched the web for others' experiences and struggled to find any convincing discussions of whether they really do meet these specifications. Some people report unencouraging experimental results, others simply repeat the specification verbatim. Data sheets typically just say things like "0-100% humidity and ±2% typical accuracy". Data sheets for serious, precision sensors will provide a varying scale of errors as a function of humidity and temperature and normally only claim precision of 2% despite costing ten times as much. The DHT22 may be ±2% near the middle of its range, but can we really believe those errors do not increase near 0 and 100?
UPDATE: Since first writing this page a much improved data sheet has recently appeared which contains both clearer translations to English and more detailed specifications and plots. It still claims a typical accuracy of ±2%, but does now show the accuracy degrading to ±5% at the two extreme limts, <10% and >90%.
Accurately and repeatably measuring relative humidity is notoriously tricky (note the 1–2%RH quoted accuracy even for professional meteorological instruments costing $1000+) so I decided to run some experiments of my own. Objectives were to determine how good these sensors are and if possible derive a correction curve to improve on the factory calibration. The manufacturer's calibration is permanently defined in these devices and not user adjustable so they cannot be re-calibrated in any physical sense. We can however build a look-up correction transformation.
I stress a few points first and hold these in mind when assessing whether you believe and trust my results.
- This is all based on my sample of six devices. I cannot say how good yours are.
- My devices were bought in two batches and five of them have near sequential serial numbers, so my sample might be regarded limited.
- The data presented here are based on a series of tests conducted over the period of a year. Some comments are also included about long term stability, but I present no detailed analysis of long term drift on multi-year time scales.
- I am no expert in hygrometers. I just devised the best experiment I could based on my reading of several papers on the topic and using a few items of household equipment I had lying around.
I planned to spend a couple of weeks on this experiment. A year of data logging and two complete rebuilds of the test apparatus later I feel as though I have got a feel for how these devices operate. It has all turned into a far bigger undertaking than I had ever imagined.
Conclusion
I will start with my conclusions for those who do not want to read all the following or you can jump to the numerical answers.
- My devices initially performed impressively. Whilst I never achieved ±2% absolute accuracy over the full range 0–100% RH, they did when first tested deliver a higher accuracy than I had expected for such a cheap device. (My expectations were pretty low!) The maximum errors I measured in my initial calibration was +6% RH and that only on one of my six devices. Typical errors were 2–3% RH at a constant room temperature (20°C).
- The output values have a significant temperature dependence of up to 8% RH over the range 10 < °C < 40. In my tests, temperature stability is possibly these devices' weakest feature.
- I have seen some evidence of hysteresis in the measurements, but it is small and almost irrelevant compared with the temperature effects.
- On timescales of hours I find repeatability in the range 0.5–1% RH as specified on the data sheet.
- On longer time-scales I see serious repeatability problems. Capacitance humidity sensors are generally regarded as being susceptible to long term drift. I have seen little evidence so far of slow systematic drift, however after about nine months of reasonably consistent behaviour one of my sensors suddenly changed behaviour by a very large margin. A second failed after about one year of use. Output values changed by more than 20% RH. Had this happened in a sensor deployed in the field instead of being in the test cell I might never have known and would be getting highly erroneous data.
- My fine-tuned recalibration curves typically have amplitudes of order 5%. Many of the devices show long term variation of a similar scale which means there is probably little realistic point applying these bespoke recalibration curves. For some of my sensors, the calibration curves do still seem valid after about a year. In the long term, repeatability variations look possible to exceed errors in any one-off calibration.
- Relative humidity is strongly temperature dependent and unless you go to considerable efforts to ensure thermal stability and homogeneity throughout the apparatus (±0.1°C), any errors measured risk being dominated by experimental systematics rather than inaccuracy of the sensor.
- The built-in thermometers easily meet the data sheet specification, however two of my devices exhibit problems with self-heating so consistently read higher than the ambient environment.
- Excepting the two failed devices (from sample of six), given all the subtle and complicated errors inherent in humidity measurement, I would say that these devices fulfill most reasonable expectations for non-safety-critical, domestic DIY projects. The problem when trying to rely on them though would be knowing when a device failed since the outputs still look reasonable.
Calibrating hygrometers
The method adopted here, purely on the basis of being the only one that is reasonable to attempt using a few common household items, is that of critical relative humidity above a saturated aqueous solution. If you seal pure water in an air-tight vessel, the water will evaporate until the balance of liquid and vapour reach an equilibrium at 100% relative humidity. Water vapour will then evaporate and condense, exchanging between liquid and gaseous phases, but always maintaining a balance at 100% RH. This is in practical terms a definition of what 100% RH means. This gives a method for setting the 100% calibration point of a hygrometer; simply put it is a sealed box with some water. You can set the 0% calibration point by sealing the sensor in the box with an aggressive desiccating agent. In practice neither of these help very much since the device is likely to be non-linear and at its least accurate near the two extremes so these data may tell you little about how it behaves in between. Also, zero and 100 are rarely experienced in real life so calibrating them is of limited interest.
As a water soluble chemical dissolves, its atoms interfere with evaporation at the water surface, meaning the stable equilibrium between water vapour and the solution becomes less than 100%. By very precisely controlling the concentration of a solution you can control the humidity of the air above that solution. Typically sodium hydroxide (e.g., Madge 1961), sulphuric acid or lithium chloride have been used. Unfortunately NaOH and H2SO4 are both unpleasant to handle and this method is difficult without precision weights and measures. Madge (1961) provides conprehensive tables of what concentration of NaOH to use to generate any humidity you want for a range of temperatures (0–40°C). If you have good quality laboratory or jewelers' scales this might be a viable technique for home use. It only requires finding one (admittendly very corrosive!) chemical and allows you to set any humidity you want over the range 6–100%.
Instead of varying concentrations of a particular salt I use saturated solutions of several different salts. Depending on the solubility of a particular salt, a different relative humidity will be generated in equilibrium with the solution. Low solubility salts will yield high humidity because the solution is not far from being just water anyway. Very high solubility salts will conversely yield low humidity. We use saturated solutions because they are easy to achieve without making any precision measurements; dissolve as much as you possibly can and you still have residual solids which will not dissolve. In this sense they are an ideal reference since they depend on basic physical properties of the chemical and do not need to be calibrated or set up in any way. They are are self regulating and will naturally remain saturated as long as there are undissolved solids present.
The test is thus very simple in theory. Seal the hygrometer in an air-tight vessel with a sample of the saturated solution and record what the sensor measures compared to the humidity known from published lab. tests to be generated by that particular solution. In practice there are many things that can go wrong or influence your results and these will be discussed (in tedious detail) below.
The best summary I have found of this technique is that of Fossa & Petanga (2003) who describe essentially the same experiment as I perform here for the purpose of testing the hygrometers in CERN's Compact Muon solenoid(CMS). They (sensibly) restrict themselves to using just LiCl (11%), MgCl (35%), NaCl (75%) and KNO3 (92%) instead of the twelve-point calibration I attempt here. You might very fairly ask why I need a twelve-point calibration for my sensors when they managed to discover the Higgs boson with the CMS and just a four-point calibration.
The Devices
I have six devices to test. All are marked AM2302 and have individual serial numbers. Five were bought together as a set from a China-based eBay seller. These all have very similar serial numbers and were presumably manufactured in the same batch. The sixth was bought from a "reputable US-based on-line retailer" and has a clearly different SN. I have seen no significant difference between them and cannot support the suggestion I have seen on-line that those from unknown eBay traders may be grade-outs that failed the manufacturer's spec. Of course neither can I rule out that some of them are.
| Serial Number | |
|---|---|
| A | SN1305002C0 |
| B | SN1307003F2 |
| C | SN13070022E |
| D | SN13070041C |
| E | SN130700201 |
| F | SN130700A38 |
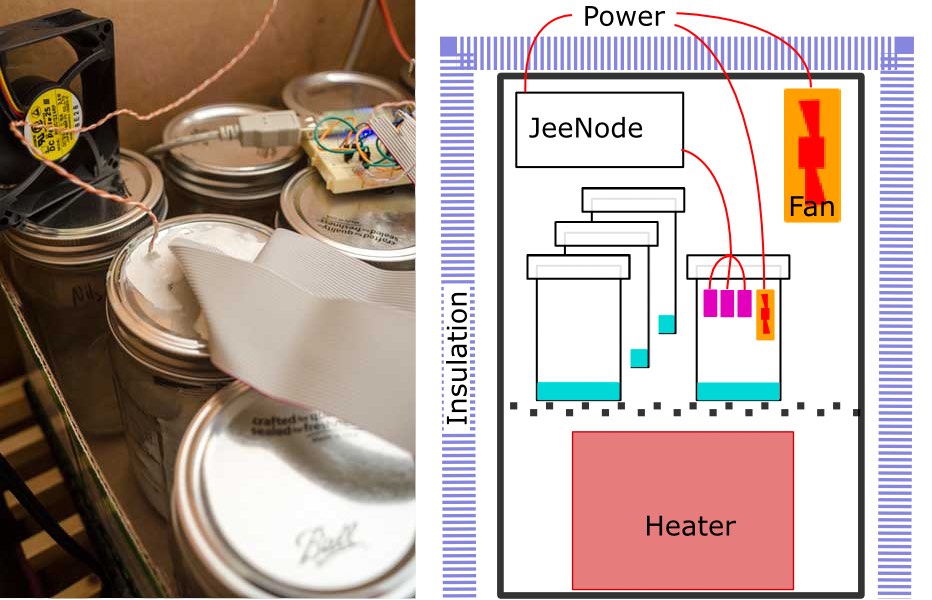
I will not give much detail of the electronic setup. Since these are digital devices which output a checksummed numerical value, the external electronics ought to be irrelevant. Once you provide a d.c. supply voltage, everything else happens inside the sensor module itself. I read the devices using a JeeNode v6, a small, low power, Arduino-like, ATMega328P board with an integrated RFM12B radio module, making it very easy to send measurements out to an external data logger. Measurements were logged into a MySQL database via the EmonCMS data logging system developed by the Open Energy Monitor project. I enthusiastically recommend the combination of JeeNodes and EmonCMS as an easy way to initially get going on any wireless, distributed, environmental monitoring system like this.
The sensors and the JeeNode were powered from a single 5V d.c. switched mode PSU. The JeeNode has it's own on-board voltage regulator but the supply to the DHT22s was fed directly from the PSU. (c.f. version 1)
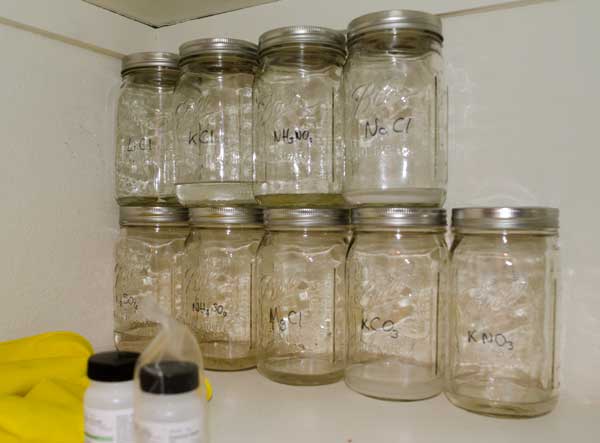
Version 1 consisted of a sealed box containing the entire experiment; the sample solution, the sensors, all the electronics and battery. Version 2 is based on two main design changes; active thermal control to ensure data were collected at a known and stable temperature and removal of all electronics from inside the test cell. The cell should be as small as possible and ideally contain nothing other than test solution and sensor. For the air-tight test cell I use a jam jar. The sensors are attached to the underside of the lid with the cables running out through holes sealed with bathroom caulk. Having a dozen identical jars allows me to keep all the solutions constantly ready for use and simply swap the sensor bearing lid onto any one. I am using US American quart Mason jars. Smaller would I think be better, but require more care in handling to prevent splashing the sensors. As well as the six sensors, a 50mm fan is also included to force better air circulation inside the jar.
The dozen jars are then enclosed in a large insulated cardboard box along with a small, low-power fan heater. The fan heater is used to actively control the air temperature inside the box. There is also another fan running continuously to force better air circulation around the jars and maintain temperatures throughout the box as homogeneous as possible. Thermal gradients of just 0.1°C anywhere in the apparatus seems to create significant errors.
Software on the micro-controller reads temperature and humidity from the six DHT22s once every thirty seconds. The temperatures are averaged and used to drive a PID controller for the fan heater. Since the heater does not have any analogue control, that needs to be approximated by pulsing the heater full on and off with the PID setting the duty cycle of typically 20–30 two-second pulses per hour. Initially four second pulses were used but more frequent, shorter pulses gave measurably better control. Both circulation fans (inside the jam jar and inside the surrounding box) run continuously and proved necessary to maintain the temperature stability.
Constraints and Considerations
Choice of Chemicals
I have not invented this technique. It is a well established method of controlling humidity, used in many fields.
- In chemical labs to hold a particular humidity over the reagents to facilitate or moderate certain reactions
- Storage of food (Rockland, 1960)
- Preservation of historical artifacts in museum display cases (Creahan, 1991)
- Biological laboratory incubation and hybridization units
- Calibration of hygrometers (Fossa & Petagna, 2003)
An extensive literature on this topic allows you to select a particular salt to generate any humidity to match your requirements. My literature survey yielded in excess of 60 chemicals previously used for this purpose and we need to select a suitable subset for this experiment. The humidity above solutions is to some degree temperature dependent because the salt's solubility is temperature dependent. Some chemicals are of course poisonous, flammable, reactive, unstable or dangerous in a variety of ways.
- I selected 40 (Figure 2, left panel) for which authors had published data at multiple points in the range 15–30°C. I can then interpolate and get a precise value for the temperature at which I obtained the reading.
- I rejected those which showed strong thermal coefficients. For example lithium nitrate varies from 55% RH at 15°C down to 31% at 30°C. I.e., it is far more soluble at 30°C than at 15°C. By contrast, solubility of sodium chloride (NaCl, common kitchen salt) is barely effected over that temperature range and the expected RH varies only from 75.3 to 75.2 %. Despite being so commonplace, sodium chloride is an outstanding candidate for this experiment. Except for the very most extreme cases (e.g., LiNO3) this selection criterion proved irrelevant and using almost any salt would give just as good results. See Temperature below.
- All were checked against databases of NFPA 704 (xkcd 2638) and EU Dangerous Substances Directive classifications to select only those I considered 'relatively safe to handle in a domestic setting' and did not pose significant disposal challenges. For example sodium dichromate would be an excellent candidate for a 56% RH calibration point but for the fact it is extremely toxic (LD50 50mg/kg — less than a teaspoon is likely fatal to an adult). Many of the compounds selected are common garden fertilizers which makes disposal at the end of the experiment relatively easy. Another interesting case is potassium chloride (KCl). This is approved as a low sodium table salt substitute in food, is commonly used medicinally and certainly seems to fulfill my 'relatively safe to handle' requirement. It is also used as the lethal injection for executions in the USA. You could likely eat a handful of KCl (LD50 ~2.6g/kg (oral, rat)), but intravenously a very small quantity is lethal. Obviously you were not actually going to inject yourself with any of these chemicals, but I mention all this as a caution to think carefully about what 'relatively safe to handle' means (xkcd 1260). Context and sensible precautions are everything. Sodium hydroxide (NaOH) is an everyday household chemical (drain cleaner) but is extremely corrosive and should be treated with utmost respect; goggles and gloves at all times.
- I read manufacturers' MSDS documents for specific handling guidelines and rejected anything vaguely scary or photo-sensitive.
- By now the list was down to about twenty compounds, about half of which proved difficult to buy cheaply in small quantities, so that defined my sample. On the expectation that the sensor would be reasonably linear and well behaved in the middle of its range, where possible I selected compounds to give a well distributed range of RH values but with extra density of data points >80% and <20%. In reality I was primarily constrained by safety and availability. Final sample is shown in figure 2, right panel.
- Multiple publications frequently differ by 2-3% RH. Where data for a particular salt are available from multiple authors I have taken a simple average rather than choosing any one as absolutely correct. However perfect our own experiment may or may not be, the absolute reference values drawn from the professional academic journals differ by 2-3% so no single measurement can ever be trusted to better than this limit.
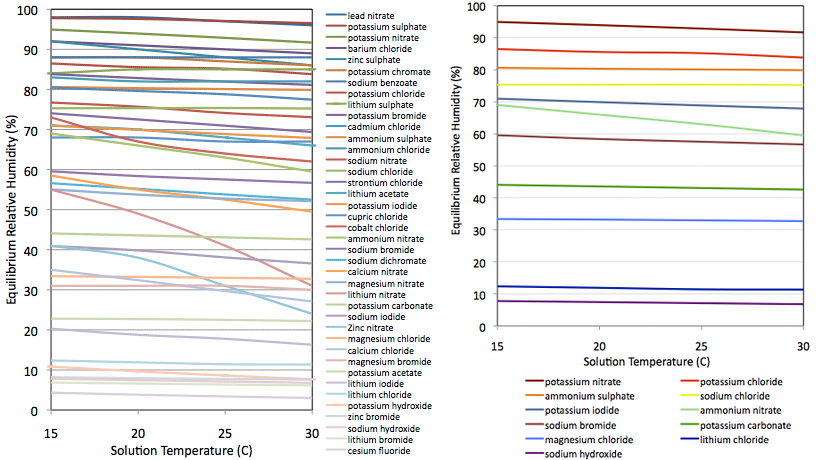
Chemicals were bought where I could find them fairly cheaply. Several were only "agricultural grade" and probably not very pure which could affect accuracy of my results. Mixtures of different salts will generally yield a lower humidity than either of the two pure components. I did buy a few (LiCl, MgCl, KI & KNO3) in fairly pure "reagent grade". The NaCl was "food grade"; simply non-iodized table salt. In Figure 2, Ammonium nitrate stands out as being the only one with a significant temperature coefficient. Calcium chloride also has a strong temperature coefficient and was used for a while. It appears in some plots but was abandoned since it has no obvious advantage over magnesium chloride and the published reference values seemed ill determined. All solutions were made with distilled water though I doubt tap water would have any real effect for the precision achieved here.
Zero and One Hundred
I made attempts at 0% and 100% humidity, but give the results rather little credence.
Distilled water was used for 100% RH. This data point will be of varying use depending on individual devices. Their internal firmware caps all output at 99.9%. Since most of my sensors seem to read marginally high, they hit 99.9% before the air is genuinely saturated making this data point meaningless. One of my sensors (B) reads slightly low at very high humidity so that does generate a usable value for pure water. Many hygrometer manufactures caution against extended exposure of the device to condensing humidity and in my experiments they do seem to take a bit longer to recover after 100% humidity than after other readings. Also anything else inside the test cell (electronics, fan, battery etc) must necessarily end up damp since 100% humidity is by definition condensing. Overall I would suggest not bothering with a 100% data point unless you really need it. As I say above, for most of my devices it was worthless anyway since they already read 99.9% when the atmosphere was really only 98%.
I experimented with dry calcium chloride dihydride for zero humidity. This will not generate a true zero. Taking numbers from "Drying Agents" (Merck, 2005), the expected absolute vapour content of the air would be ~0.4 mg/l which converts to 1.9% RH for my local conditions. Using anhydrous calcium chloride ought to improve this to 0.4% RH. I also tried silica gel beads but found the small quantity I had to hand was ineffective. Even more effective would be 4Å molecular sieve. Again taking values from "Drying Agents" (Merck, 2005), under ideal conditions silica gel could achieve 0.02% RH and a 4Å molecular sieve 0.005% RH. In practice the sensor's firmware appears to be capped at a minimum output value of 1.0% so like 100%, interpretation of the 0% data points is not simple and investing in 4Å molecular sieve is probably pointless.
I returned to calcium choride at the end. Instead of using the CaCl as a reference, I used the calibrated sensors to measure the air above dry, crystaline CaCl. I got 3.8±0.5%RH. I do think that tells us much about CaCl since I have no way to assess how well dehydrated the CaCl really was. It had been baked for a couple of hours in the oven at 200°C, but not been in a vaccuum dessicator. Given that I did not achieve the 1.9%RH predicted above for pure, dry calcium chloride dihydride, that supports my decision not to include it as a reference point in the fits.
Time
It takes time for the vapour to equilibrate. The sensors were sealed in the test vessel with each chemical for between three hours and three days. Data for my analysis are typically averages of 12–24 hours of logged values. The smaller the test vessel air volume and the larger the surface area of the solution, the quicker equilibrium is likely to be achieved. My experience is that vapour equilibrium was generally established in just a couple of hours as long as I had the fan running. Achieving stable thermal equilibrium was much more difficult and that is also easier for a smaller, simpler test vessel.
Temperature
The single biggest source of error I was able to identify was temperature and temperature stability. There are at least three different, competing, temperature dependent effects.
Temperature Effect 1: True Physical Changes in the Calibration Reference
As shown above (Figure 2), the expected RH depends weakly on temperature. The salts used were selected to exhibit smaller than average temperature coefficients. My hypothesis had been that choosing solutions which were not temperature sensitive would minimize my results' sensitivity to temperature variation. In practice this proved fairly unimportant because it is easy to calibrate out and other sources of error dominate.
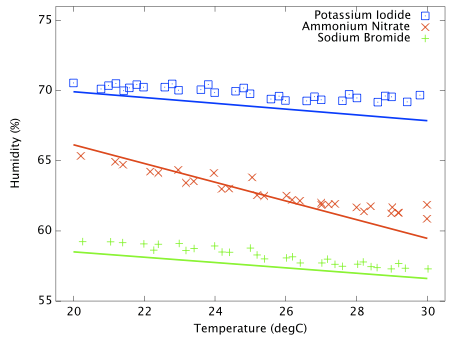
Including a temperature sensitive salt does however provide a good illustration that the experimental procedure works as expected. Figure 3 shows the measured and predicted humidity as a function of temperature for three solutions; potassium iodide, ammonium nitrate and sodium bromide. Ammonium nitrate is expected to have a much stronger thermal coefficient and the effect is obvious in this plot. All three data sets are slightly offset from the reference curves and the slope of the ammonium nitrate data does not perfectly match expectation, but it is clear that the hygrometer is responding to genuine, small humidity changes as the ammonium nitrate solubility changes with temperature. This plot is very important and greatly increases my confidence that the test cells are properly equilibrating at the set temperature.
Temperature Effect 2: Temperature Stability and Homogeneity Inside the Test Cell
More dramatic is the way the atmosphere (as opposed to the salt solution) responds to temperature change. Relative humidity is a strong function of air temperature. For a given absolute humidity (i.e., absolute mass of water vapour molecules suspended in the air) the measured relative humidity varies with temperature. For example, in my house in Summer (temperature = 23°C, pressure = 83kPa — well above sea level) atmosphere that contains 16 mg water per litre of air would be measured as 77.6% RH. Raising the temperature just 1°C to 24°C, that same water vapour would now read 73.3% and lowering the temperature to 22°C would give 82.2%. Since the diurnal variation of the air temperature in my house is about 5°C, I would expect the RH measurements in a sealed volume of air to be varying by up to 20% over the course of a single day. Clearly if my errors inside the test vessel are 20%, I can say little about the validity of the manufacturer's claimed 2% factory calibration. To obtain a measurement that is repeatable at 1% RH, we need to a test cell with thermal regulation to a precision substantially better than 1°C.
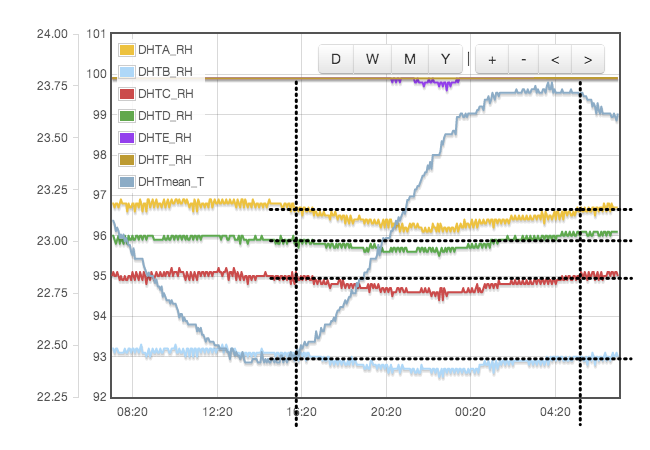
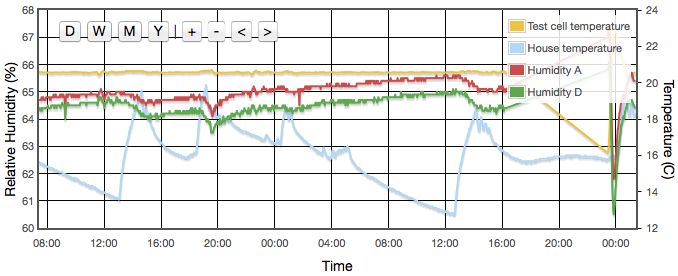
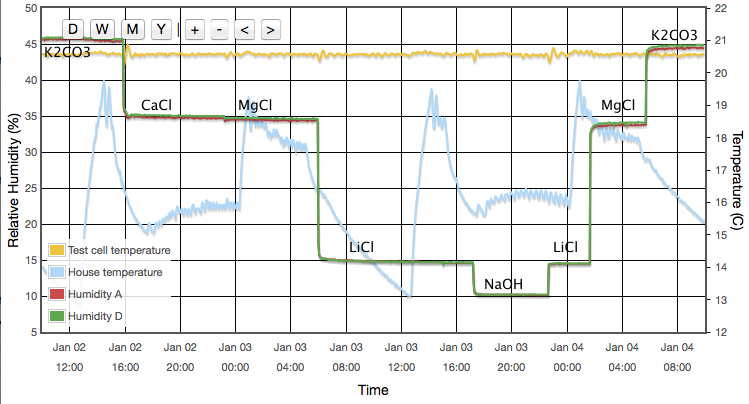
Initially one might expect the error to correlate to temperature, but for a sealed, air-tight test vessels this particular source of error correlates to rate of change of temperature or temperature gradients within the test cell. We are using the natural equilibrium which the solution, vapour and air are continuously trying to achieve. If the temperature is rising then the air is continuously being able to support more vapour, the solution will be evaporating to provide that and the measured humidity will always be lower than expected because it is always trying to catch up. Similarly when the temperature is falling, the vapour will be condensing back into the solution but is likely to always be lagging the equilibrium target and the measured RH will be higher than the calibration value we are trying to achieve. Only when the temperature remains stable for a period of time will the equilibrium be established. This effect was clearly visible in my logged data for the version 1 test cell which did not have active thermal control (Figure 4).
This problem has largely been eliminated through active thermal control and better air circulation. The PID controller keeps the measured temperature at the set point with a precision of better than ±0.03°C over any timescale from ten minutes to several days. Following a similar calculation to that above (temperature = 23°C, pressure = 83kPa), variations of 0.03°C would be expected to cause absolute errors of 0.06% and 0.15% on measurements of 33% and 85% RH respectively. These errors are small enough that we can test the 1–2% claims from the specification data sheet.
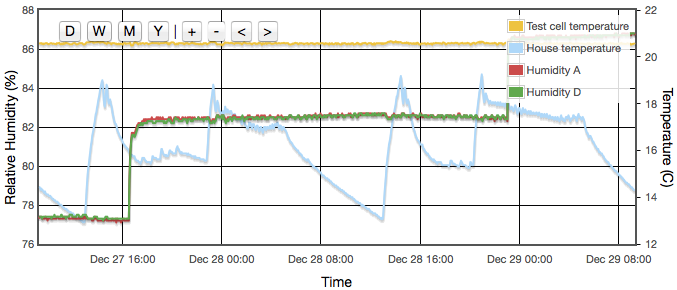
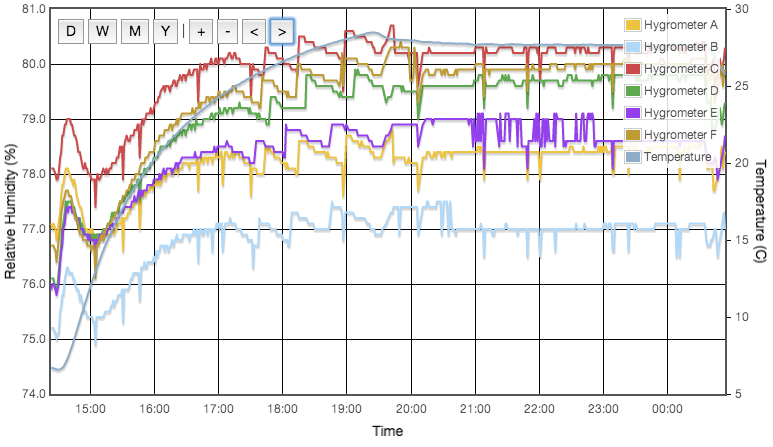
Even with the temperature regulated to better than ±0.03°C, humidity variations of up to 4% were still observed and were precisely correlated to the air temperature of the house, outside the experiment box. How can the house temperature effect the results when the temperature inside the jar was fixed? The cause was temperature gradients in the equipment. The thermostatic control is based on the temperature at the sensor. If there is a temperature gradient (i.e., spatial variation) inside the cell then that can cause exactly the same error as if the temperature varied temporally. A 1°C difference between air around the sensor at the top of the jar and the liquid at the bottom could create up to a 5% RH error. Addition of fans both inside the jar and circulating air around inside the box reduced this error to an acceptable level. For humidities less then 50% there is now no measurable drift over timescales of a few days. Above 50% RH, I still see drifts of less than 0.3% on day time scales. In these cases, values for the final analysis were taken as one day averages. Contrary to version 1 there was no need to pulse the fans since they are no longer battery powered and thermostatic control removes concern about the fan motor heating the air. Various duty cycles were tested but running continuously gave clearly stablest results.
Both fans, inside the jar and inside the temperature regulated outer box, proved necessary to get anywhere near a sufficiently stable environment.
Temperature Effect 3: Temperature Sensitivity of the Sensor
So far I discussed experimental systematic errors. Finally I come to temperature sensitivity of the sensor itself which is what the experiment was intended to determine. The manufacturer's data sheet says they are "temperature compensated" during the factory calibration procedure but in my experience that process is far from perfect. Over the temperature range I have tested (10 < °C < 40) the RH output varies by between 3 and 8%, so for all six devices temperature alone accounts for more than the claimed 2% precision. See the results section below for more detail. Any attempted recalibration procedure needs to be a function of both humidity and temperature.
UPDATE: The newer much improved data sheet now specifies that the quoted accuracy of ±2% is tested at a constant 25°C. That means the statement above about the temperature induced errors exceeding the data sheet specification is strictly no longer true. The new data sheet has no explicit specification for errors as a function of varying temperature.
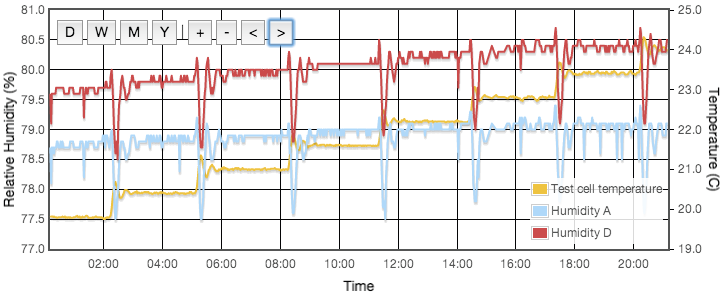
Another temperature related defect I see is a sawtooth discontinuity in the humidity values when the temperature is varying around 25°C. Illustrated in Figure 6, I have no clear explanation for this but hypothesize it is a numerical artifact in the sensors' internal calibration. It is likely also related to the discontinuity visible in Figure 10 at around 25°C. Though it is dramatic and possibly even alarming to see discontinuous jumps in the RH output value, do note that the steps are <0.5% RH so well within the device specification.
Quantity and Preparation of the Solutions
The less air volume inside the test vessel and the more surface area of the saturated solution, the quicker equilibrium is likely to be achieved. A deep bucket of solution will not particularly help. A wide shallow pan is likely to be better. It is sometimes recommended that you use a mound of dampened solids rather than an actual liquid solution, though for particular salts (e.g., calcium chloride which has a variety of hydrated solid crystalline forms) this will not work. In most cases I endeavoured to get the best of both methods by using a shallow (only 1-2mm depth) pool of saturated solution with a small mound of thoroughly wetted solid piled up in the middle. The idea here is to have all of the liquid, solid and gasous material phases in contact to allow the equilibrium to establish. A deep pool of solution could in theory stratify to be saturated at the bottom but have a less than saturated layer floating on top. Ideally the solution would be mixed during the experiment but this is not easy to arrange. If you have a magnetic stirrer, that would be a great addition to the set up. You must make sure the solution really is saturated. Make sure there are still solids present in the solution which refuse to dissolve even after several hours and ideally have those solids break the surface of the liquid.
A related problem is supersaturation. For some salts it is possible to heat a solution until all the solids dissolve and then cool it again without the salts precipitating back out as crystals. This happened to me a couple of times. It is simply avoided however, again by ensuring that some solid crystals are always present even when the solution is at its warmest. As long as there are any crystals present, the solution is unlikely to supersaturate as it cools.
Hygroscopic Materials
Hygroscopy is the tendency of a material to absorb water vapour into its surface and hold it within its molecular structure. Possibly surprisingly, many plastics (e.g., nylon, ABS, acrylic, polyurethane, polycarbonate, PET, PBT) which may be hydrophobic (liquid water will bead on the surface and run straight off) are in fact hygroscopic (absorb water vapour). This manifests as a sink or source of humidity other than the saturated solution, greatly extending equilibration time. If the salt solution is releasing vapour to the air, the walls of the test cell could be absorbing it meaning you need to run the experiment for a very long time before equilibrium is eventually achieved. If you then switch to a salt that yields a low humidity, the walls of the test vessel will slowly release that stored vapour back into the air. There is considerably more detailed discussion of this problem as it was a major factor for version 1 of this experiment. For the results presented herein however the test cells were glass and contained the absolute minimum of other components which seems to have eradicated this problem.
Results
Part 1: As a Function of Humidity
First we look at the varying response of the sensor to different reference humidities, all measured at a single fixed temperature.
| Salt | Reference | Measured RH % | |||||
|---|---|---|---|---|---|---|---|
| RH % | A | B | C | D | E | F | |
| NaOH | 7.42 | 10.17 | 11.16 | 11.29 | 10.20 | 9.60 | 8.88 |
| LiCl | 11.90 | 14.68 | 15.40 | 15.49 | 14.70 | 13.99 | 13.34 |
| CaCl | 32.07 | 34.74 | 34.69 | 34.96 | 35.02 | 34.22 | 33.01 |
| MgCl | 33.18 | 34.37 | 34.36 | 34.69 | 34.62 | 33.71 | 32.61 |
| K2CO3 | 43.52 | 45.59 | 45.53 | 45.99 | 45.82 | 46.50 | 43.65 |
| NH4NO3 | 65.58 | 65.98 | 65.27 | 66.23 | 65.61 | 66.83 | 65.87 |
| NaCl | 75.31 | 77.56 | 76.38 | 77.44 | 78.09 | 77.60 | 79.74 |
| NH4SO4 | 80.31 | 82.54 | 80.91 | 81.97 | 82.51 | 81.88 | 85.42 |
| KCl | 85.57 | 86.73 | 84.86 | 85.93 | 86.73 | 86.06 | 90.94 |
| K2NO3 | 93.77 | 96.43 | 93.36 | 94.43 | 95.21 | 95.80 | 99.90 |
| H2O | 100.00 | 99.9 | 99.4 | 99.9 | 99.9 | 99.9 | 99.9 |
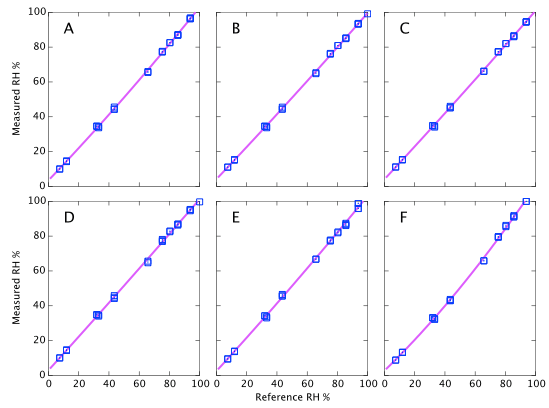
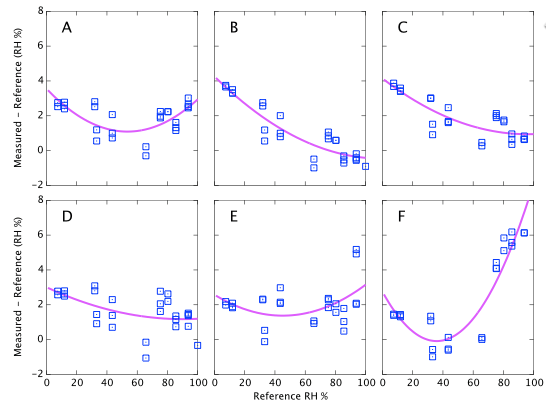
Figure 9 above represents the simplest conclusions of the experiment. Devices A, D & E all consistently read about 2% high. Devices B & C read 4% high when dry but tend towards quite accurate at high humidity. Device F is the only one that shows large deviations from correct. It reads accurately below 60% but deviates quite strongly (up to 6% absolute error) at high humidity. I reiterate that these data are all at a fixed temperature and do not represent the thermal dependence of the devices. Depending on the expected use of the sensors, it will be shown below that thermal effects may lead to much larger errors in real World data.
Repeatability (on time scales of a few weeks) is about 1% RH as specified (Figures 9, 10, and 11). However on year time-scales I have seen such large changes in the sensor output that these corrections of 2 - 5% possibly become irrelevant.
I tried a variety of polynomial fits and data smoothing techniques (moving average, Savitzky-Golay filter, Tikhonov regularization) and nothing beyond the quadratic presented here seemed justifiable. The data scatter is sufficiently large that trying to quantify anything more complicated than a smooth, low-order trend over fits the available information. There is no physical justification for a quadratic fit over any other representation, e.g., a spline, but a quadratic correction function is attractive because it is very easy to apply and invert analytically.
There are some features which are seen identically in all six sensors which leads me to believe they are experimental systematics rather than faults in the sensors. For example, MgCl and CaCl are both expected to read ∼33%. For all six devices the CaCl data points are consistently higher than the MgCl points. It seems likely that one or other of the reference values I am using is inaccurate. (CaCl was later dropped from the experiment because of this, its temperature coefficient and the complicated behaviour of its various hydrated crystalline forms.) The same is true for other salts which consistently appear above or below the fit lines. E.g., NH4NO3 falls about 1% below the fit for every sensor. This seems to suggest that all absolute calibration values should only be believed to the ±1% level, which is no surprise. As noted earlier, data drawn from published journals frequently differ by 2-3% for any given salt; another illustration that these sensors are accurate enough to reveal limitations in the experiment rather than the reverse. For completeness I also note that similar discrepancies could arise through impurities in my salt samples.
There are systematic variations as a function of humidity as you would expect and a multi-point calibration is clearly helpful. However if I had used a single point calibration with NaCl at 75% as might reasonably be performed by any user of these devices, the results would not have been all that bad. Sensors A, D & E show only weak trends and a single point calibration would be adequate. They always read about 2% high. Device F is the only case where a one-point NaCl calibration could make 'corrected' results worse than doing nothing. It would lead you to believe that sensor reads 4% high, whereas in fact it is the most accurate of the six below 60% RH.
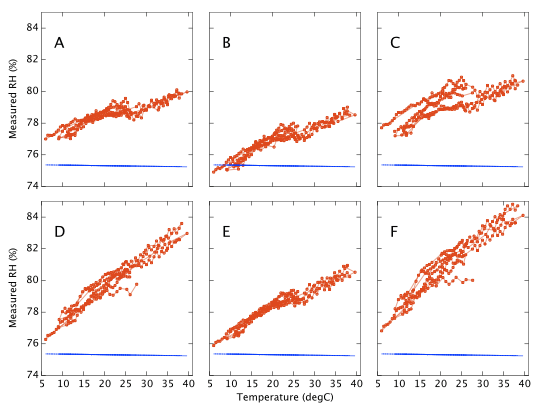
Part 2: As a Function of Temperature
This shows the varying response of the sensor to a fixed constant humidity as the temperature is varied.
The sensors were sealed for several weeks in the NaCl jar with the temperature incrementally stepped up and down between 10 and 40°C. The temperature was held at each set point for at least three hours, a reading being taken as the average humidity over a period of about one hour when the RMS temperature was stable to better then ±0.03°C. Working in Winter I was able to get a few data points as low as 6°C even though I have only a heater (no chiller) for thermal control. Results are shown in Figure 10. Device A drifts by only 3% RH as the temperature changes. Device F, again the worst of the six, varies by 8% RH. Most show a distinct wobble or discontinuity around 25°C, presumably related to the 'sawtooth' response already noted in Figure 6. Repeatability on timescales of days to weeks is typically better than 1% RH, though device C exhibits a greater variance.
Repeating with LiCl and subtracting off the reference humidities gives Figure 11 which represents our final estimate of the measurement error as a function of temperature. All six sensors respond alike at low humidities (LiCl ∼13%) but behave quite differently at high humidity (NaCl ∼ 75%).
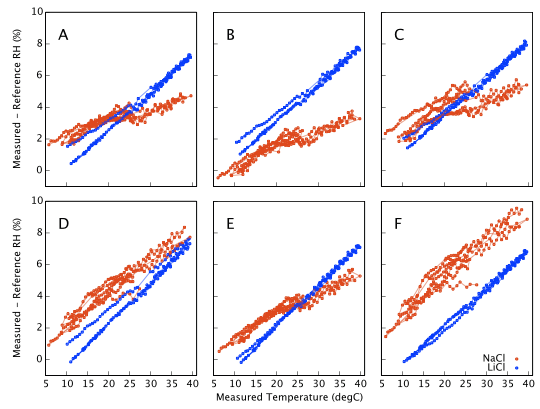
The fact that the two data sets in Figure 11 (NaCl 75% and LiCl 13%) do not overlap illustrates that a proper recalibration would need to be a bivariate function of both humidity and temperature, or alternatively a fully populated 2D look-up table. That is not a quick job. The full temperature range needs to be sampled multiple times for each salt in turn.
Part 3: As a Function Simultaneously of Temperature and Humidity
Finally, if the sensor is to be used to measure humidity under a range of varying temperatures a full bivariate calibration is required. Such a calibration over the rather moderate temperature range 20 < °C < 30 is shown in Figure 12. Over this narrow temperature range the thermal effects are not large but Figures 10 and 11 show that if the sensors are to be used over a wider 5 < °C < 40 range then the bivariate calibration would be necessary.
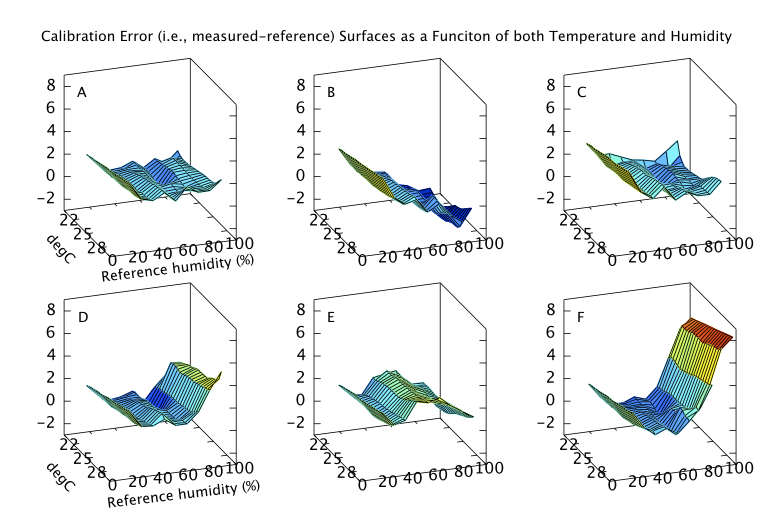
The curves in Figure 9 should simply be cross sections through these surfaces. For A,B,C and F this is indeed the case. A is fairly flat. B and C both decline towards higher humidity and F diverges very steeply for RH values greater than 70%. For sensors D and E the comparison is less favourable. This would seem to indicate a change in behaviour of these sensors over the intervening few months which separate figures 9 and 12. Response has not grossly changed, they still consistently read a couple of per cent high, but the details of their response do look different.
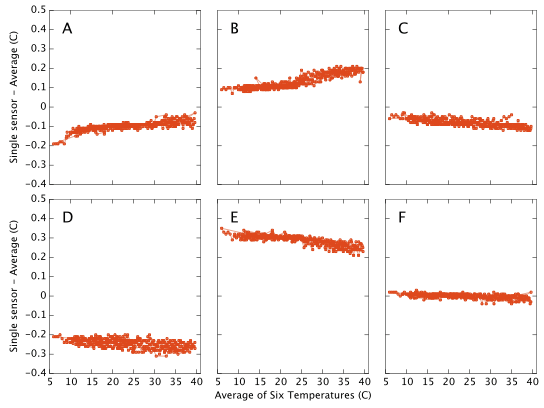
Temperature Accuracy
This document is about humidity measurements and was motivated by the fact that hygrometers are difficult instruments to build and calibrate. By contrast, the technology for manufacture of cheap and accurate thermometers is well established and we would expect the temperature output from the DHT22/AM2302 to be pretty good. This appears to be the case and for completeness I present the results here with little discussion. My apparatus contains no external reference against which to calibrate the temperature output and I therefore simply plot each sensor's offset from the mean of all six sensors. I am strictly only showing the difference between the sensors, but the absolute calibration looks likely to be good to ∼0.5°C with a relative drift of <0.1°C over a 30°C range. Repeatability for most of the sensors is ±0.01°C. (Repeatability for sensor D is ±0.02°C) These numbers easily meet or exceed the data sheet specifications.
Long Term Stability and Failure of Sensor B
After about nine months of continuous use, one of my six devices started producing apparently deviant results. This is described in a separate account, but briefly, the problem turned out to be the control board inside the device overheating. Perhaps the on-board controller is not correctly switching itself to standby mode after each measurement. The sensors themselves were actually still working fine, but since the device was self-heating it did not represent the real ambient conditions.
Conclusions
Back near the top of this page.
If you have comments or suggestions feel free to contact me. robert -AT- kandrsmith.org
Lessons learned and advice for repeating this experiment
Having been through several iterations of trying to perform this experiment, here is a brief summary of lessons learned on how I would recommend setting the experiment up.
- Keep test cell air volume as small as reasonable
- All glass or stainless steel where possible
- Active thermal regulation and homogeneity (∼0.1°C) throughout the setup are critical.
- Lots of fans to stir up the air everywhere help. At least in my setup, the fan inside the jar was critical to maintaining proper equilibrium.
- Use a shallow pool of solution with some residual solids breaking the surface to maintain saturation and avoid supersaturation.
- Low humidity results are typically easy and stable. Getting stable results above 50% is difficult. Optimize the equipment setup using NaCl and then you know the lower humidity salts will work easily.
- Watch a single salt for at least a couple of days to make sure the results are really stable before trying to swap to others.
- Perform an ordered sequence from high to low humidity and back from low to high again. Then average the two readings for each salt.
- Perform the calibration at the temperature where the sensors will be used. If you need the sensors calibrated at more than a very narrow range of temperatures, that too will need to be varied systematically.
- Do not expect any quick answers. Having spent six months developing the techniques, using my current home-made apparatus I estimate I could collect the required data for a full multi-point calibration in a little less than three months. This is clearly impractical as a calibration procedure for such a cheap device.
Future Plans
Possible future extensions of this work:
- This work has been extended to look at SHT71, DHT11, BME280, Si7021, HTU21D, AM2320 and AM2321.
- Repeat in a few years' time to look for sensor degradation. This may no longer be required. I have already seen significant changes on six month time-scales.
- More thermometers scattered around inside the apparatus might be useful to test the hypothesis that most of my systematic errors were due to thermal gradients.
References
Some of these papers are in academic journals which require pay subscription access, so you may only be able to read the abstracts on-line.
- Creahan J, 1991, WAAC Newsletter, 13, 1, pp.17-18, "Controlling Relative Humidity with Saturated Calcium Nitrate Solutions"
- David S Madge, 1961, Entomologia Experimentalis et Applicata. 4, 143-147. "The control of relative humidity with aqueous solutions of sodium hydroxide"
- Fossa M. & Petagna P., 2003, CMS NOTE 2003/024, "Use and calibration of capacitive RH sensors for the hygrometric control of the CMS tracker"
- Greenspan L., 1977, J Res Nat Bur Stand - A Phys Chem, 81, 89, "Humidity fixed points of binary saturated aqueous solutions"
- Merck KGaA, 2005, Publication W.283123, "Drying Agents"
- O'Brien F.E.M, 1948, J. Sci. Instrum., 25, 73. "The Control of Humidity by Saturated Salt Solutions"
- Rockland L.B., 1960, Analytical Chemistry, 32, 1375, "Saturated Salt Solutions for Static Control of Relative Humidity between 5 and 40 C"
- Weast R.C., 1979, CRC Handbook of Chemistry and Physics, Boca Raton, Florida, Chemical Rubber Company, p. E-44.
- CRC Handbook of Chemistry and Physics. 1995 by CRC Press
- Wexler A. & Hasegawa S., 1954, J Res Nat Bur Stand, 53, 19, "Relative humidity-temperature relationships of some saturated salt solutions in the temperature range 0 to 50 C"
Acknowledgments
Though I designed and integrated the entire experiment, I must acknowledge the many open source projects, both software and hardware, that I used.
- Jeelabs produce the JeeNode micro-controller board
- I developed my software using the Arduino tools and environment, using some parts of the AdaFruit DHT22/DHT11 library, Brett Beauregard's PID library and Markus Schatzl and Carl Jackson's Sensirion library.
- My data logger is EmonCMS from the Open Energy Monitor project running on a Raspberry Pi.
- MySQL database, Apache web-server and of course the 10,000+ people who have contributed all across the Linux operating system.
- The plots and numerical analysis were generated in Flot and Octave.
Almost vaguely related and possibly of interest is monitoring home radon.
Mon Jul 25 16:05:15 UTC 2022