Long Term Stability and Failure of Sensor B
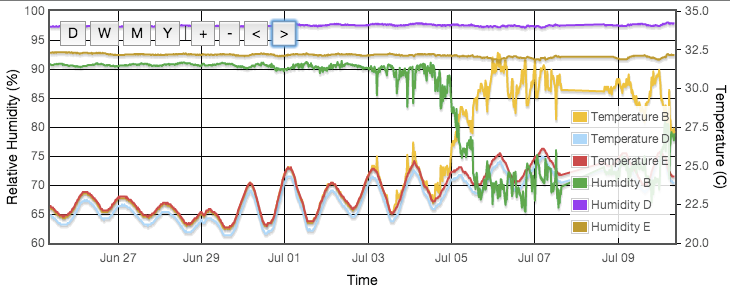
After all the data were collected for my initial calibration and write-up the sensors were left continuously logging the potassium nitrate solution. Thermal control was off so temperature simply traced the ambient room temperature. After a few months sensor B appeared to spontaneously fail. In Figure 1 you see B, D and E all tracing each other well until data from B begins to become noisy around 1st July. On 5th July the behaviour of the sensor changes radically, suddenly reading 20% RH lower and about 5°C higher. Interestingly the device has actually remained linear and is perfectly calibratable. The calibration scale simply seemed to change. The sudden change in behaviour is obvious when in the test cell with other sensors but had this happened when the device were deployed in the the field it would have produced spurious readings, possibly with no obvious indication. Over the following six months sensor B remained mostly in its 'bad' state but would occaissionally return to working correctly for periods of up to a week. All six sensors share a power supply. The supply voltage is monitored and shows no disturbance.
Self-Heating
It is signifcant in figure 1 that the temperature and humidity on sensor B strongly anti-correlate when it is in its 'bad' state. Just by touch I was able to feel the back of the device was distinctly warm. In fact the measurements that the device was around 5°C warmer than the other five was actually correct. Having later dismantled the device (after collecting all these data) it seems the heat from coming from the on-board microcontroller, though I am not certain of that. The datasheet says the device should automatically switch to standby after taking a reading. Maybe this is not happening reliably, meaning the microcontroller is continuously powered.
Since the device is generating heat it warms the air around it. There is effectively a fixed absolute humidity in air since that is regulated by the ambient temperature of the saturated solution. The sensor therefore correctly measures a lower relative humidity because the warm air around the sensor is not in equilibrium with the cooler air filling the jar and the solution at the bottom of the jar. Since we have a direct measurement of how hot the sensor is running, we can analytically predict how far off the humidity measurements will be, using standard gas equations. Over the period logged for this experiment sensor B was reading on average 4.6°C warmer than the mean of sensors D,E and F. Sensors A and C, adjacent to B on either side, each averaged 1°C warmer. We can then calculate that with 4.6°C heating, the RH output from B would be expected to give a factor 0.781 times the saturated solution's equilibrium humidity. The 1°C for sensors A and C cause a factor 0.947. In figure 3 I demonstrate that the apparently erroneous RH values from sensor B are perfectly explained by simply rescaling by 1/0.781.
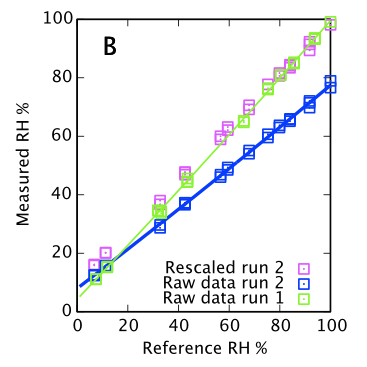
I conclude that the sensor elements themselves are still fine and are indeed still being read accurately. The sensor running hot for unknown reasons distorts the local environment causing highly biased readings. A brief web search revealed a couple of other users seeing very similar symptoms, but I have no way of quantifying how common it is, other than saying one of my six devices has the problem.
Mitigation Strategies
I am impressed with the accuracy achieved by the DHT22 for the price, but they do have reliability problems. I had one failure out of six devices after nine months and three failed over two years. Two of the devices are still in routine use after about three years. You may never feel inclined to trust them. I therefore suggest some possible reliability mitigation strategies. I have not implemented any of these.
- Installing and averaging multiple DHT22s could provide a very accurate if not convenient solution. It would improve system robustness and you could reject deviant points if a device failed.
- Including any other cheap thermometer in your equipment would provide a check on the DHT22's thermometer and alert you to any self-heating failure.
- Since the problem is self-heating, presuambly the current draw has increased, so maybe if you were to monitor that you might be able to detect an instrument which has failed in this mode.
- A fan pushing sufficient air through the sensor to dissipate the self-heating would give better results, but that seems a rather poor solution.
Back to the index of all my hygrometer testing.
2017-03-28 12:52 PM