Wide range of Hygrometers, Year 2:
Long term stability, sensor contamination and reconditioning
Page Contents
Introduction
This is an update and supplement to Wide range of Hygrometers: DHT22, AM2302, AM2320, AM2321, SHT71, HTU21D, Si7021, BME280. I will not repeat the detailed descriptions of the apparatus and methods that are given there and in Test and Calibrate DHT22 Hygrometers.
I recently received some very friendly and helpful feedback from an engineer at Sensirion who told me that the one problem I experienced with my Sensirion SHT71 was characteristic of a contaminated sensor. Looking at my previous tests (e.g., Many sensor comparison figure 4 or DHT and SHT comparison figure 4), my SHT71 has consistently shown a linear tilt in the calibration. The device performed admirably in all aspects except for this one systematic error trend. Polymer-based capacitive humidity sensors work by measuring the changing capacitance of the polymer material as it is permeated by varying levels of water vapour. It is obvious that if something other than water vapour manages to enter and gets retained within the sensor then the resulting output value will be wrong. This risk of contamination has always been a common issue for all capacitance hygrometers and is one of the reasons they are great for low-cost devices, but typically not used as laboratory-grade reference sensors. However what I learnt from the engineer at Sensirion is that the tilt I see is the typical symptom for a device that has been contaminated by volatile organic compounds (VOCs). They typically have a lower dielectric constant than water and systematically tilt the calibration in the manner seen.
The hypothesis is therefore that I have been testing a device that had somehow been contaminated right from the start. My SHT71 has been very stable and repeatable for more than three years operation, but always had that calibration tilt. The good point here is that the tilt has not greatly changed with time, so it always was calibratable and being a linear tilt it only ever needed a two-point calibration to adequately measure and correct. The complicated multi-point calibration I performed here was never necessary.
All the various manufacturers specify a procedure for restoring a contaminated sensor. This generally amounts to 'baking' the sensor in a dry atmosphere to drive off the contamination and then reconditioning for a period of time in a warm and relatively benign moist atmosphere. In the SHT71 documents, the recomended process is baking at 100–105°C and <5%RH for 10 hours followed by re-hydration at 20–30°C and 75%RH for 12 hours. I had not previously attempted this because of lack of confidence in maintaining the baking temperature for such a long period. With my other tests complete, I now decided there was nothing to lose if I destroyed the sensor and it was worth trying. My aparatus was extremely crude. I simply sealed the sensor in a metal can with freshly dried calcium chloride and baked it in my domestic kitchen oven at 100°C for ten hours. The sensor was rehydrated over saturated sodium chloride (75%RH) for about five days. Theory suggests that calcium chloride should give air at <2% RH and my own measurements showed that I was achieving <4%RH. Sealing the can is maybe not ideal since I am constraining any contaminant that does get driven off to just get reabsorbed. Also, the thermal regulation of my oven is unlikely to be particularly good. Despite these many shortcomings, my interest was really just to see i) if the device survived at all and ii) if its calibration changed.
The test method uses a variety of saturated aqueous solutions and the aparatus has all been previously described. One limitation here is that my aparatus relies on a heater for thermal regulation. That means I can only test at temperatures above ambient and I can only perform the previously reported bivariate analyses (0–100%RH, 5–35°C) in Winter. Without any active cooling, the lower temperature limit is set by the ambient temperature in my garage. Since Spring has arrived early in Colorado this year, I have elected to run the test at a fixed temperature of 25°C.
The devices included are:
- Aosong AM2302 (A.K.A. DHT22). These are the same two devices as have been in all previous test runs. They are two of the three remaining functioning devices from my original set of six. In terms of performance they were by coincidence the best and the worst of the six.
- Sensirion SHT71. The same device as has appeared in multiple previous tests but has now been through the bake and reconditioning process. This is the device we want to see whether it has changed.
- Measurement Specialties HTU21D. Does not have the PTFE protective membrane.
- Silicon Labs Si7021. Includes the PTFE protective membrane.
- Bosch Sensortec BME280. Two have been included.
These are all specific devices that have been tested before, just over one year ago. The hope here is that they will perform similarly to last time and I can then see how the SHT71 has changed. Images of the physical devices may be found in the many sensor comparison, figure 1. The same page includes commentary on the differences between the devices design and specifications. The AM2320 and AM2321 devices are not included this time since both were giving me frequent, intermittent errors last year.
Results
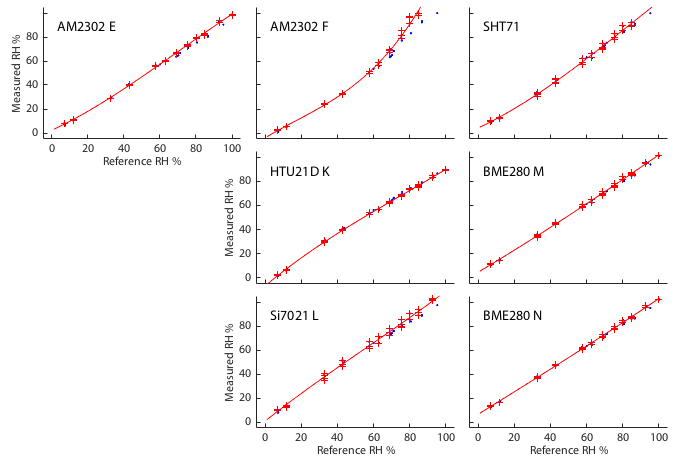
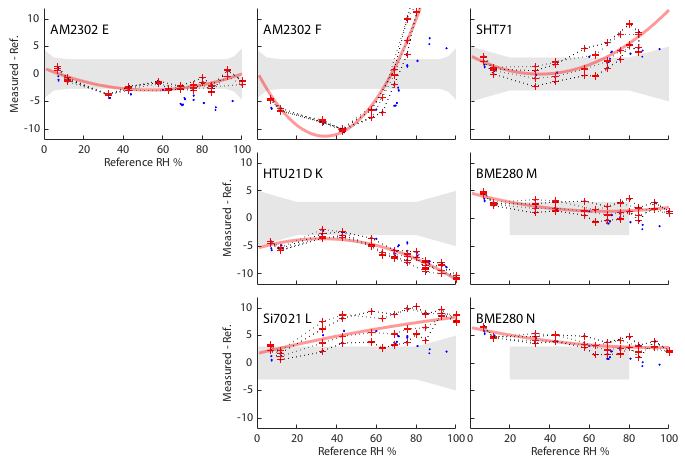
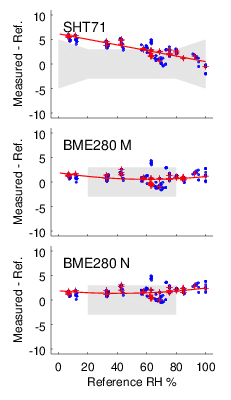
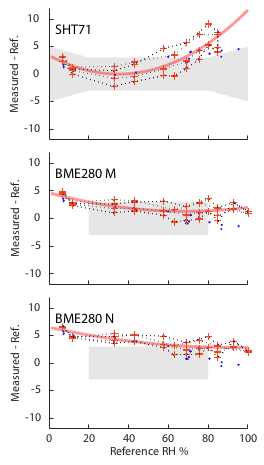
To allow direct comparison, I present the results here in very nearly the same format as the last iteration of the test on these same devices. The one slight change is that in Figure 2 I have integrated the hysteresis information and calibration fits into a single figure. Figure 1 shows the direct comparison of raw sensor reading to the reference data whereas Figure 2 shows the inferred measurement error for each sensor as a function of humidity. Red points were obtained at a regulated, constant 25°C and the red curve is a quadratic fit to those data. The blue points were obtained at other temperatures, typically about 14–16°C, but not systematic sampling a full temperature range. The black dotted line (Figure 2 only) joins the red data points in the sequence in which they were obtained and thus circumscribe the hysteresis envelope that shows how the device's output is biased by its recent history.
Effect of the SHT71 sensor bake
Undoubtedly the bake and reconditioning has had a huge effect on the device. The calibration is now very different from before. Where it used to be good at high humidity and diverged to read too high at low humidity, it is now precisely the opposite. It is accurate at low humidity and reads high at high humidity. I am not sure I would now call it better overall, but the fact the baking made such a big difference is some support to the hypothesis that the sensor was contaminated and my previous experiments were never a fair test of a 'normal' SHT71. My ill-constrained baking procedure seems to have 'moved the contamination around or changed it', but not fixed it. It obviously makes no sense to talk about stability of this device, but previous tests showed that before leaving it the even overnight it was very stable.
BME280
These show possibly the most interesting and unanticipated result. They are still pretty good but have clearly degraded over the intervening year. They are have lost both the accuracy and the linearity that they previously exhibited. One is still within specification, but the other has just marginally drifted out. Even more interesting, the form of the degradation has pushed them towards looking like the SHT71 previously had. In fact the BME280s now look remarkably like the SHT71 had in all previous tests. Is it possible that these devices have now accumulated atmospheric contamination much the same as the SHT71 previously had? I suspect it is significant that these are the only sensors that have been outside the sealed calibration test jars in the intervening year, actually being used in the real world. All the others have remained in the controlled atmosphere of the calibration test cell.
AM2302 / DHT22
This year's test data look much like last year's. These two devices are just as good and bad as they have previously been. Sensor E remains very good. At 25°C it is within specification and shows virtually no hysteresis. Though not properly investigated here, the blue data points reveal that it does have a temperature sensitivity and the few colder data points in this plot are consistent with the previous more extensive test. A quadratic fit is not adequate to represent the highly curved data for sensor F. A cubic is fine.
HTU21D and Si7021
This year's test data look just like last year's. They seem to have been nicely stable over the intervening year. One point of interest for the Si7021 is that consistent with last time I looked at hysteresis, this device again seems to stand out as suffering the most among all the sensors tested. I remind you that this device still has the PTFE membrane installed, which might be blamed for trapping air, but specific tests performed with the cover removed showed almost no measureable difference. In contrast, this particular HTU21D is showing the joint least hysteresis of any device in the test.
Conclusions
- Baking
- Baking and reconditioning has made a big difference to the SHT71. It still works and has a very different, though not obviously improved, performance.
- It remains plausible that my particular device was contaminated from the very start and was never entirely fair to be compared to the rest.
- Baking is worth trying if you have a contaminated device, but it is something of a last resort and you may be far better off just buying a new one.
- Long term test (>1 year since last write-up)
- Having spent the intervening year sealed in the test aparatus, the AM2302/DHT22, HTU21D and Si7021 all look unchanged. Remember the AM2302s are a self-selected sample in that most of their original peers have failed.
- Having been exposed for several months to real world atmosphere, it is disappointing to see both BME280s have degraded. They are still easily the match of any of the others and arguably still the best of the lot, but the razor flat calibration has been lost.
- Sealed in a jar, all have shown good stability (except the one I baked!), but exposed to atmosphere in real world use there is an ever present threat of contamination.
- Hysteresis
- These particular HTU21D and AM2302 show very little hysteresis.
- This particular Si7021 shows disappointingly strong hysteresis.
Next task is to start again with new Sensirion devices and see if they do indeed perform better than this first one.
If you have comments or suggestions feel free to contact me:
References: See here.
Acknowledgements:
- Many thanks to gentleman from Sensirion who took the time and effort to contact me about the problems I was having with my SHT71. This probably does not need saying, but I should make it clear that Sensirion has never tried in any way to coerce me to write this update or change anything that I had previously written.
- Descriptions of software libraries used may be found here.
2018-02-24 3:01 PM