Compare DHT22, DHT11 and Sensirion SHT71
Page Contents
Introduction
My previously published results compared six AM2302 (a.k.a. DHT22, RHT03 and I use the names interchangably throughout) hygrometers. Here I repeat that experiment using the same apparatus and techniques but replace two of the sensors with alternative models, a DHT11 and a Sensirion SHT71. The objectives of the earlier work were to establish whether a sensor as cheap as the AM2302/DHT22 could live up to their claimed accuracy. My conclusion was that in my experiments they did not, but they did deliver surprisingly good performance and very good value for money for most non-safety-critical, domestic DIY projects. The next obvious question is whether my tests would show a more expensive device to be better. Since I was re-running the experiment I also included the even cheaper and lower specification DHT11.
Data sheets for the DHT11 and DHT22 devices tend to be brief. The numbers in the following table appear on datasheets and are typically quoted by retailers. The Sensirion datasheet on the other hand is detailed and comprehensive providing accuracy as a function of humidity as well as details of recommended calibration and linearization procedures. Note how Sensirion's absolute accuracy claims are less strict and more believable than those normally quoted for the DHT devices.
| Manufacturers' Specification | |||
|
AM2302 / DHT22 | DHT11 | SHT71 |
| Range | 0-100% | 20-90% | 0-100% |
| Absolute accuracy | ±2% | ±5% | ±3% (20<RH<80) ±5% (RH<20, RH>80) |
| Repeatability | ±1% | ±1% | ±0.1% |
| Long term stability | ±0.5% per year | ±1% per year | <0.5% per year |
| Typical street price | US$ 4-10 | US$ 1-5 | US$ 30-50 |
UPDATE: Since first writing this page a much improved data sheet has recently appeared which contains both clearer translations to English and more detailed specifications and plots. It still claims a typical accuracy of ±2%, but does now show the accuracy degrading to ±5% at the two extreme limts, <10% and >90%
Accurately and repeatably measuring relative humidity is notoriously tricky. The procedures used here were developed over a period of about a year and are detailed on my DHT22/AM2302 calibration page. I am no expert in hygrometers. I just devised the best experiment I could based on my reading of several papers on the topic and using a few items of household equipment I had lying around.
The Devices and Test Apparatus
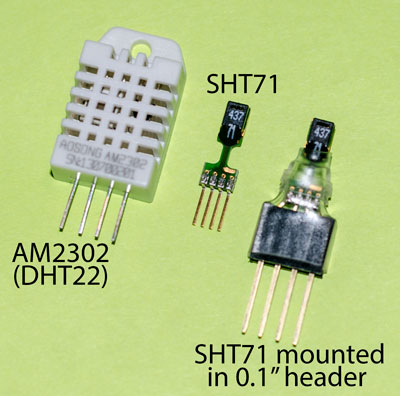
The AM2302/DHT22 devices are the same units as I used previously. They are A,B,D,E and F from my previous write-up. Though five are mentioned, only four were under test at any one time. Sensor B failed during the experiment and was replaced by E. I have added a DHT11 and a Sensirion SHT71.
Apparatus setup is as previously described. All sensors were powered from a 5V d.c. switching power supply. New software needed to be added to microcontroller to read the Sensirion device and was based on Markus Schatzl and Carl Jackson's Sensirion Arduino library.
The reference calibration sources are still the same too, eleven saturated salt solutions and distilled water. Data were all collected in a similar manner to before with the sensors being allowed to stabilise for a few hours with each solution.
Quality of build
At more than ten times the price the SHT71 is unsuprisingly far superior to the others. It is both smaller and feels more solid. The gold plated Cu/Be alloy pins are very robust in comparison to the DHT22 on which the pins honestly feel like they are made of thick aluminium foil. Note that the SHT71 has 1.27mm separation pins which does make it less easy to hook up to common hobbyist 2.54mm Arduinos and bread-boards. I mounted mine in a 2.54mm header block for easy handling.
Response Speed
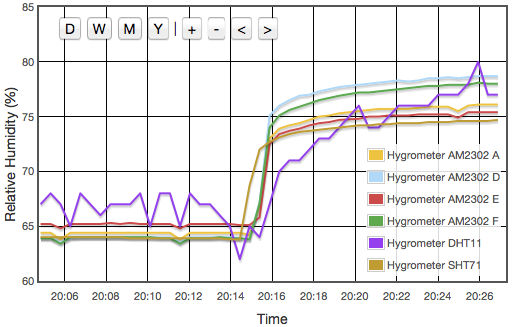
The SHT71 consistently responded to changes the fastest, registering a change in a few seconds. The DHT22/AM2302 appears to take about 30sec and the DHT11 can take a couple of minutes. However, the DHT22 caches a reading in memory and returns it whenever a value is next requested. Since I am only sampling every 30sec, the DHT22 values are always from 30sec ago which is why the step change in Figure 2 lags 30sec behind the SHT71.
All sensors (including the SHT71) can take several hours to fully stabilize at high humidities. Though some of this may be the device, I suspect it genuinely takes several hours to equilibrate and saturate the air inside the jar after a swap. Still, the relative fact that the SHT71 is the fastest and DHT11 the slowest is obviously real since they are all together measuring the same air.
Results
Part 1: As a Function of Humidity
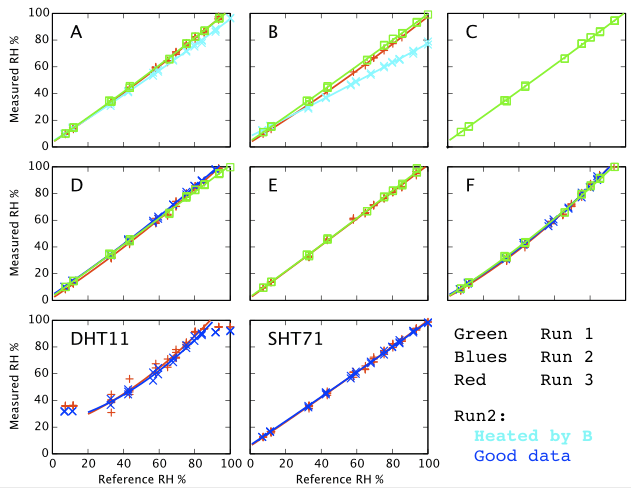
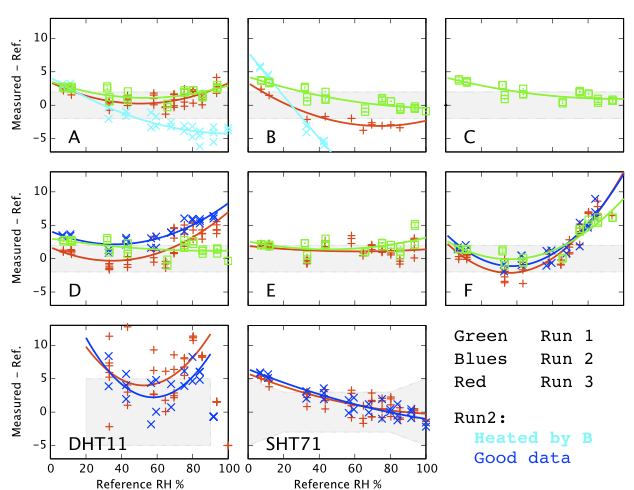
First we look at the varying response of the sensor to different reference humidities, all measured at a single fixed temperature.
| Compound | Ref. | Measured RH % | |||||
|---|---|---|---|---|---|---|---|
| RH % | A | B | D | F | SHT71 | DHT11 | |
| NaOH | 6.8 | 9.7 | 12.5 | 10.2 | 8.4 | 12.7 | 31.8 |
| LiCl | 11.2 | 14.0 | 15.8 | 14.8 | 12.9 | 16.6 | 31.9 |
| MgCl | 32.8 | 31.6 | 29.2 | 33.9 | 31.4 | 35.4 | 38.9 |
| K2CO3 | 42.6 | 41.4 | 37.0 | 45.3 | 42.6 | 45.4 | 46.5 |
| NaBr | 56.6 | 54.4 | 46.5 | 59.0 | 56.7 | 57.4 | 57.9 |
| NH4NO3 | 59.4 | 57.1 | 48.9 | 61.9 | 59.7 | 60.7 | 61.9 |
| KI | 67.9 | 65.0 | 54.6 | 71.8 | 69.1 | 68.4 | 70.3 |
| NaCl | 75.3 | 71.8 | 60.1 | 80.3 | 78.9 | 75.8 | 80.3 |
| NH4SO4 | 79.9 | 75.9 | 63.4 | 85.7 | 84.6 | 80.1 | 86.3 |
| KCl | 84.0 | 79.1 | 65.6 | 89.6 | 91.3 | 83.8 | 89.6 |
| K2NO3 | 91.7 | 87.4 | 71.1 | 98.0 | - | 91.6 | 91.0 |
| H2O | 100.0 | 96.4 | 77.8 | - | - | 98.1 | 92.0 |
| Compound | Ref. | Measured RH % | ||||||
|---|---|---|---|---|---|---|---|---|
| RH % | A | B | D | E | F | DHT11 | SHT71 | |
| NaOH | 7.3 | 9.7 | 9.7 | 8.4 | 9.4 | 7.8 | 35.8 | 12.6 |
| LiCl | 11.8 | 14.0 | 13.3 | 12.8 | 13.8 | 12.1 | 35.9 | 16.3 |
| MgCl | 33.1 | 33.3 | 31.0 | 31.9 | 32.7 | 30.9 | 38.9 | 35.5 |
| K2CO3 | 43.4 | 44.1 | 41.7 | 42.8 | 45.4 | 41.6 | 48.6 | 45.3 |
| NaBr | 58.1 | 59.2 | 56.1 | 59.2 | 61.0 | 58.3 | 63.3 | 59.7 |
| NH4NO3 | 64.7 | 64.1 | 61.0 | 63.9 | 65.4 | 64.1 | 67.4 | 64.2 |
| KI | 69.5 | 70.2 | 66.7 | 72.3 | 71.3 | 71.2 | 74.0 | 70.4 |
| NaCl | 75.3 | 76.4 | 72.2 | 79.0 | 76.4 | 79.3 | 82.4 | 76.2 |
| NH4SO4 | 80.2 | 82.0 | 77.3 | 84.7 | 81.0 | 86.6 | 91.4 | 81.4 |
| KCl | 85.3 | 86.3 | 82.0 | 88.0 | 85.1 | 93.0 | 93.7 | 85.2 |
| K2NO3 | 93.5 | 96.3 | - | 98.0 | 95.3 | - | 95.0 | 93.5 |
| H2O | 100.0 | - | - | - | - | - | - | 98.7 |
Sensirion SHT71
This is the best of the sensors. It is the most linear, most stable over time and arguably the one with the smallest absolute deviations though cherry picking the best of the DHT22s, they are comparable. It may justify its cost if you have a need for that extra accuracy, and particularly reliabilty. For most everyday purposes the other sensors are probably adequate except for the gross inconsistency caused by sensor B's self-heating. Repeatability and consistency is where the SHT71 seems to win easily. Finer manufacturing tolerances and quality control are presumably what you are paying for with the more expensive devices. RMS scatter around the fit line is 2%RH, but this is only an estimate of the overall accuracy if the correction curve is applied and for as long as that correction curve remains unchanged. Note that that 2%RH scatter includes systematic errors in my apparatus as well as measurement errors in the sensors. The true humidity generated by each solution is only known to about 2%RH. For example all the sensors give 1–2% lower than expected readings for ammonium nitrate at 22°C, suggesting it is the reference data I am using that is in error rather then the sensors. Without my own correction curve, errors from the sensor after applying the manufacturer's default calibration from the datasheet are up to 5%. All my data points nearly remain within the shaded area of the manufacturer's specification.
DHT11
As specified on the data sheet, this device is of no use below 20% or above 90%, but then in terms of physical comfort, anything above 90% humidity feels the same, i.e., wet. Similarly at anything below 20% my lips start cracking so for many uses the difference between 5% and 15% may not be important. The repeatability (scatter of the data points) is markedly worse than all the other sensors (±5%) but within its valid range (20 < %RH < 90) its absolute calibration is almost as good as the DHT22s. A calibration curve is not justified by these data though a constant offset of about 4% would appear to improve reading accuracy. If the self-heating of sensor B was affecting the adjacent DH11 then the required offset could be slightly greater. A data run without the self-heating B was started, but then abandoned when I decided to no longer pursue use of this device.
DHT22 / AM2302
Sensor A Ignoring run 2 which was corrupted by faulty sensor B, this device looked good until just before the end of the experiment when it became the second of the six DHT22s to fail. When working, it consistently read 2% high.
Sensor B is highly problematic. During the second data run the device was faulty and running hot. The heat was also influencing its own local environment so it has little use as a measure of the surrounding ambient conditions. Even when not self-heating in run 3 its behaviour seems to have changed to some degree. This device has been scrapped.
Sensor C Only tested once during which its results were remarkably similar to the SHT71.
Sensor D has changed more than the specification allows, but is still tolerable with a 5% error or so. Its changes are not explained by local heating from sensor B. Applying any of the correction curves would improve the other measurements so it is showing some consistency, but it has clearly changed.
Sensor E looks good. Divergence at 100% could just be a couple of data logging errors in run 1 and if you were to ignore them it has remained very consistent.
Sensor F has changed little between measurements. Unfortunately it has the most aggressively curved of all the calibration curves, but it has at least remained reasonably constant. If I were applying a correction curve derived from the old data it would still be valid now.
Part 2: As a Function of Temperature
The above measurements were taken at fixed temperatures (30°C and 22°C). Next we look at how the sensors react over the range 10–40 °C. There are two effect to be disentangled. We wish to measure whether the sensors' response changes with temperature, but we know the humidity generated by the solutions is itself temperature sensitive. The 'reference values' are therefore no longer fixed constants, but temperature dependent slopes. DHT22 sensors A,D,E,F, the DHT11 and the SHT71 were tested with all the saturated solutions and plots for three are presented in Figures 5, 6 and 7. The compounds selected for inclusion here are:
- NaCl because it is by far the most studied and well calibrated of our set and also because it has the weakest temperature dependence. For this one special case we hardly need to plot a slope. The humidity is a fixed 75% over our full temperature range.
- NH4NO3 because it is the one compound included with a very stong temperature coefficient. If the sensors are working this will show a strong slope in marked contrast to NaCl.
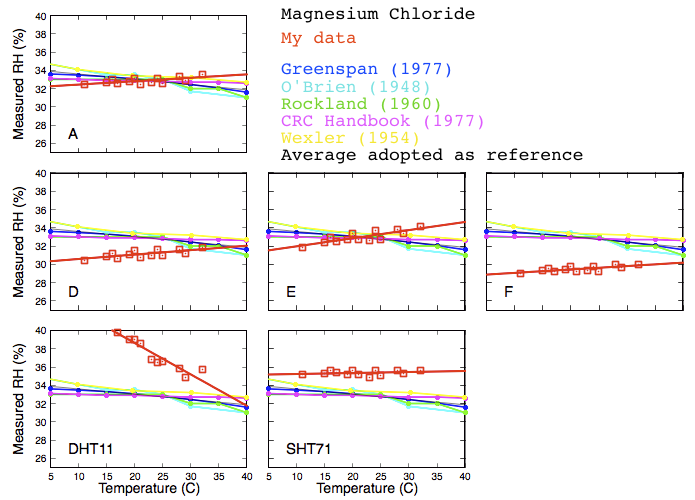
- MgCl selected as another very commonly used compound and being in the low humidity range, distinct from the other two.
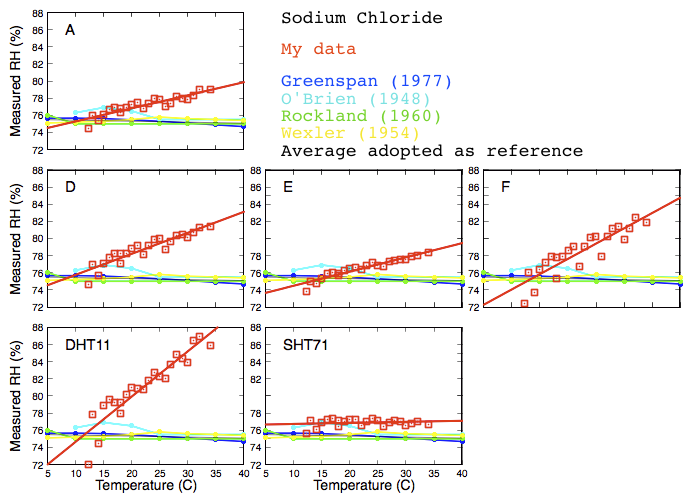
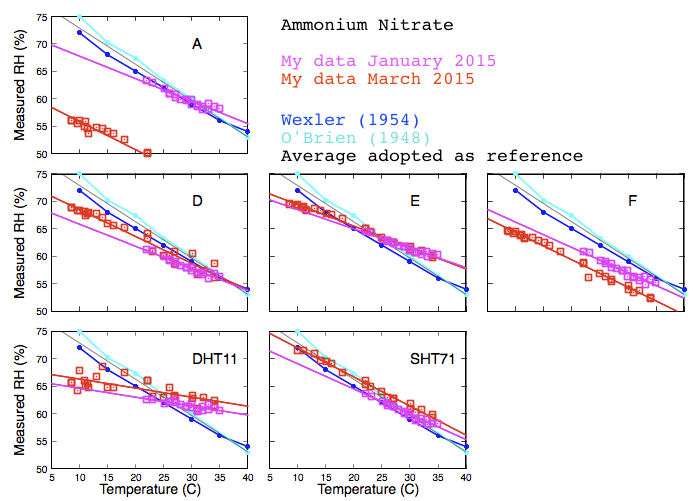
These plots demonstrate again a point made repeatedly that these experiments are only as accurate as the availability of calibration references and the literature shows a considerable variation. Look for example at ammonium nitrate in Figure 6. My two data runs with the SHT71 show a systematic offset which is presumably sensor calibration drift, but that offset is only about the same same as the discrepancy between the published Wexler and O'Brien data sets.
The very obvious difference between Figures 5 and 6 demonstrates the success of the system setup. As with Figure 3 on the DHT22 report the primary conclusion of this is that we can clearly differentiate between sensor sensitivity changes and genuine environmental changes and our conclusions regarding sensor calibraton are valid, not experimental error.
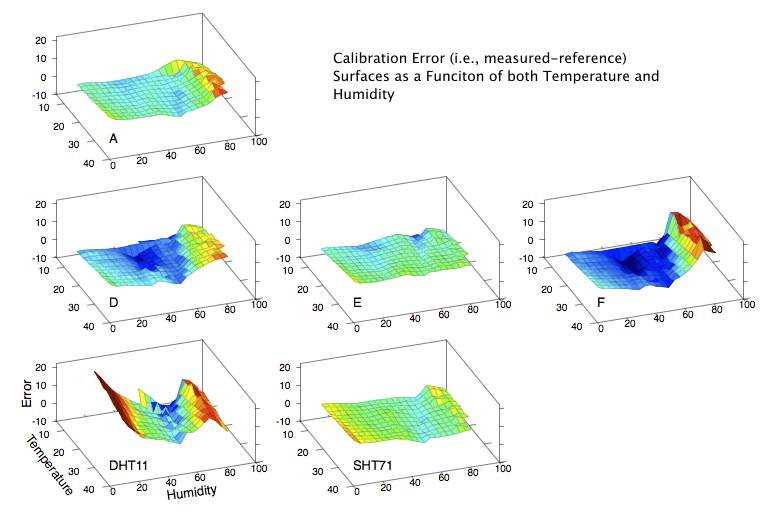
Part 3: As a Function Simultaneously of Temperature and Humidity
Finally, if a sensor is to be used to measure humidity under a range of varying temperatures a full bivariate calibration is required. Such a calibration over the rather moderate temperature range 10 < °C < 35 is shown in Figure 8. The curves in Figure 4 are effectively cross sections through these surfaces.
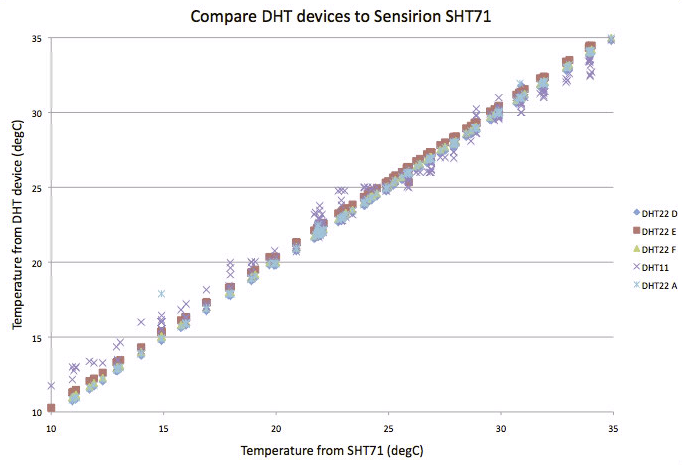
Temperature Accuracy
At a correspondent's request I include a quick comparison of the temperature outputs. My apparatus contains no external reference against which to calibrate the temperature output and I therefore simply plot a direct comparison. Strictly this only shows they agree, not that they are all correct, but I don't think it is seriously in doubt that they are good enough for most purposes. The DHT22/AM2302 devices match the SHT71 well. SHT71 and E differ by a constant 0.4°C, the biggest divergence I have seen. Most of the others differ by ∼0.1°C. This is all consistent with my previous DHT22/AM2302 only results. The DHT11 does exibit more scatter but I have normally seen the specification given as ±2°C and my test device delivered ±0.7°C. I have elsewhere looked at absolute thermometer accuracy of the BME280, but that test has not been applied to these sensors.
Conclusion
- The SHT71 is clearly superior to the DHT22. It is better made, at least as accurate, more precise and responds more quickly to change. It does of course also cost ten times as much.
- Particularly striking is the much better thermal stability of the SHT71 compared to the others. (For example, Figure 5.)
- Reliability may justify the higher cost for you. After a couple of years, my single SHT71 is running fine.
- Two of my six DHT22 / AM2303 devices have failed. Life expectancy is around one to two years.
- After 18 months of continuous operation only one of my six DHT22 / AM2303 devices (device E) is able to match the performance of my SHT71. Of course it is possible that I got the one good SHT71, but I do not consider that likely.
- The DHT22 certainly is better than DHT11 and easily justifies its extra cost. I shall not bother playing with the DHT11 any further, but it certainly does work if you have need for a cheap, lower spec. device.
If you have comments or suggestions feel free to contact me. robert -AT- kandrsmith.org
References: See here
Acknowledgements: See here
Almost vaguely related is a test I have started monitoring radon in the house too.
2017-03-17 10:09 AM