Write-up in progress. In fact the data are still being collected (Feb 2016). Expect results here on a timescale of a couple of months.
Wide range of Hygrometers:
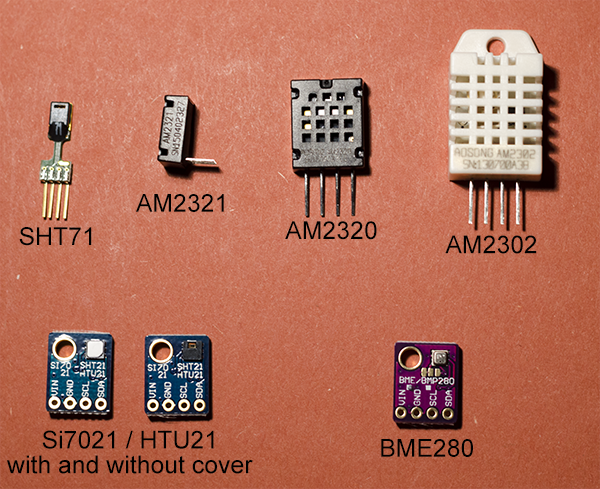
DHT22, AM2302, AM2320, AM2321, SHT71, HTU21D, Si7021, BME280
Contents
Introduction
Previous experiments looked at comparing a set of six Aosong DHT22/AM2302 and compared the Aosong DHT22/AM2302 with the Aosong DHT11 and Sensirion SHT71. Here I have added five new devices meaning this test now covers most commonly available low-cost digital hygrometers. This page will present only new results. For details of how the experiment works, please refer to the previous write-ups.
The devices now included are:
- Aosong AM2302 (A.K.A. DHT22)
- Aosong AM2320
- Aosong AM2321
- Sensirion SHT71
- Measurement Specialties HTU21D
- Silicon Labs Si7021
- Bosch Sensortec BME280
The DHT11 is clearly a different class of sensor with substantially lower specification and has been dropped from further investigation. In my tests it performed perfectly well with respect to its specification, but I am only interested in devices designed to read the full range 0–100% RH.
The Devices and Test Apparatus
Aosong AM2302
Also commonly known as DHT22. Two devices (E & F) from my previous experiments have been included. Device E was selected as the best of the six I originally started with. [AM2302 datasheet]
Aosong AM2320 & AM2321
The AM2320 is effectively the latest version of the AM2302 with the addition of an option to communicate over I2C interface. It is physically a little smaller, but with identical pin-out. The one-wire serial of the AM2302 is retained making this a simple drop-in replacement. [AM2320 datasheet]
The AM2321 appears to be the same but in a much smaller physical package and narrower pin pitch. It might be electrically identical. There is some suggestion from the manufacturer's web site that this might already be discontinued and replaced by AM2322. I am not sure. [AM2321 datasheet]
The sensing elements in these are likely the same as each other and I presume similar to the AM2302/DHT22. The internals of these devices are not exactly the same as the DHT22 because they do not exhibit the very distinctive sawtooth behaviour around 25°C.
Sensirion SHT71
The same device as was used in previous tests. [SHT71 datasheet]
Measurement Specialties HTU21D & Silicon Labs Si7021
I discuss these together though they are distinct devices from two different manufacturers. In normal use they are interchangeable both in terms of specification and communications protocols and even have the same I2C address so are drop-in replacements for each other. Similarly the Sensirion SHT21 (not included here) also has a near identical specification and interface. I have seen the same third party generic break-out boards being sold with any one of these devices attached. (See Figure 1.) The one difference I have found and possibly the only way to be sure which device you have is in the devices' unique serial numbers for which each manufacturer uses a slightly different format, detailed in their respective datasheets. So long as you do not attempt to read the device serial number, these three sensors function identically. That is not to say they will all perform identically. Though equivalent for most normal use, the precise specification details do differ. [HTU21D datasheet, Si7021 datasheet]
An interesting feature of the SHT21, HTU21 and Si7021 is that they are available in options with or without a protective PTFE membrane over the sensing element. For this test I am running one device each, with and without. (See Figure 1.) The intent had been to include an identical pair of sensors with and without the cover, however when my devices arrived I found the retailer had sent me HTU21s without the cover and Si7021s with the cover. Functionally the sensors are identical, but it does mean that I do not have a perfect like-for-like comparison of the same device with and without the cover.
Bosch BME280
This device is a bit different. First, unlike all the other devices tested it includes a barometer. Though an interesting addition and I will write about it elsewhere, for the present report I present only the temperature and humidity data.
Second, it possibly works on an entirely different physical principle from the other sensors here. As far as I have been able to acertain, all the other devices are polymer capacitance hygrometers. The Bosch website, datasheet and press releases contain no information that I have been able to find about what is inside the BME280 other than an implication that it is a MEMS device. Sensortec is specifically the MEMS subsiduary of Bosch. So what actually is a MEMS hygrometer? I can imagine a tiny dew-point hygrometer constructed in a MEMS, but have no idea if that is really what it is. Alternatively the sensor could still be a capacitance device. The list of technical capabilities advertised on the Sensortec website seem suitable for building such a device into an integrated unit with a MEMS barometer. If anyone can enlighten me on what is inside the BME280 I would be most interested.
The datasheet has no accuracy specification outside the range 20%<RH<80%, but my past experience from other Bosch Sensortec devices is that the specifications are rigourous and conservative. They seem to under-promise and over-deliver, so a priori I am not expecting problems outside the specified range. [BME280 datasheet]
As previously demonstrated for other sensors (DHT22, SHT71), driving this device too fast can lead to self heating. Contrary to the other devices though, this can occur straight out of the box, in the factory default configuration. In its default configuration, rather than taking a reading on demand, the device continuously reads values as fast as it can, returning the latest available value on request. The sampling rate is controlled by setting the 0xF5 memory register and the various speed options are defined in the datasheet. When running at the default full speed my device returned temperatures 0.5°C warmer than when running at one sample per second. At one sample per second values agreed with the polled operating mode where the device was put to sleep between readings. For the present experiment speed is of no consequence and I operated at 1 sample/sec.
| Manufacturers' Specification | |||||||
| AM2302 | AM2320/AM2321 | SHT71 | HTU21D | Si7021 | BME280 | ||
| Operating Range | 0–100 | 0–100 | 0–100 | 0–100 | 0–100 | 0–100 | |
| Absolute accuracy (%RH, 25°C) |
±3% (10-90%) ±5% (<10, >90%) |
±3% (10-90%) ±5% (<10, >90%) |
±3% (20-80%) ±5% (<20, >80%) |
±3% (20-80%) ±5% (<20, >80%) |
±3% (0-80%) ±5% (>80%) |
±3% (20-80%) | |
| Repeatability (%) | ±0.3 | ±0.1 | ±0.1 | - | ±0.025 | - | |
| Long term stability (% per year) |
0.5 | 0.5 | 0.5 | 0.5 | 0.25 | 0.5 | |
| 1/e Response (sec) | 5 | 5 | 8 | 5 | 18 (with cover) 17 (without) |
1 | |
| Voltage supply (V) | 3.3–5.5 | 3.1–5.5(AM2320) 2.6–5.5(AM2321) |
2.4–5.5 | 1.5–3.6 | 1.9–3.6 | 1.71–3.6 | |
The Test Apparatus
Apparatus setup is essentially as previously described though a new board had to be built to hold nine devices inside the jars. The AM2302 and SHT71 devices have proprietary one-wire serial interfaces and were addressed independently, each using a separate GPIO pin as in the previous experiments. All the other sensors were multiplexed onto the I2C bus. I2C is able to address multiple devices on a single bus so long as each has a different address, but since I have multiple samples of the same device I am not able to identify each one uniquely. I therefore use a TI CD4051 8x1 multiplexer so that only one of the devices is connected to the I2C bus at a time. The devices are powered continuously, but the I2C IO lines are briefly connected to each device in turn. This would not have been required if I had only one each of the different device models.
The reference calibration sources are the same as before, eleven saturated solutions and distilled water. Sensors were allowed to stabilise for a few hours with each solution. The software automatically steps the temperature over a pre-defined range, allowing the readings to settle at each temperature and logging a reading to a database before stepping to the next temeperature.
Response Speed
Results pending.
Protective Cover on HTU21D / Si7021
It seems reasonable to expect the devices with a protective cover over the sensor would respond more slowly. Though I do see a marginally slower response, the difference is really very small and on balance I would suggest that including the cover should generally be the default choice. The compromise of accepting a response that is just a few seconds slower whilst gaining protection of the sensor element from contamination seems very sensible. Example data to follow.
Results
Throughout the following plots you will notice the data for sensor G are a little more sparse than the others. Both my AM2320 devices fail intermittently above about 60% RH. At low humidity they consistently give valid data but at higher humidities they frequently just return zeroes. I never found the cause. At least the values are obviously wrong and an extra function was added to the microcontroller code to simply reject the bad data. The others all continue uneffected but values were only logged from this sensor when they were sensible.
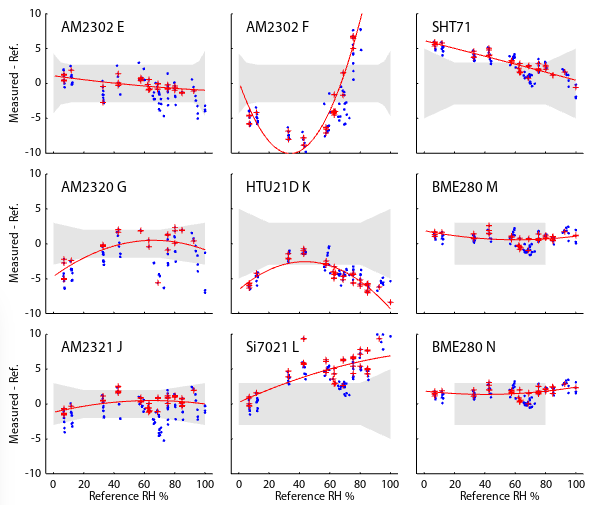
Part 1: As a Function of Humidity
First we look at the varying response of the sensors to different reference humidities 0–100%. Figures 3 and 4 contain the same data plotted with different axes. Figure 3 shows the actual relative humidity values measured and Figure 4 shows the deviations from a perfect calibration. The manufacturers' specifications are all defined at 25°C so I highlight those data in red. Data obtained at other temperatures are shown in blue.
It is vital to note that data are still being collected so no conclusions should be drawn yet from any of these data. The fits are currently a little unconstrained at the high end. The plots will be updated as data become available.
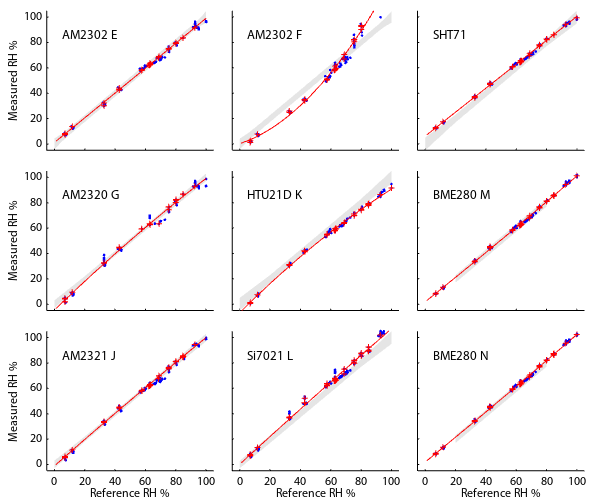
Both of the above figures have equivalents in previous test runs where you can see earlier results for SHT71 and AM2302 E, F. The other six are new and this is their first test.
Part 2: As a Function of Temperature
In Figure 4 the red data are measured at 25±1°C and the blue data at other temperatures. Device E (an AM2302/DHT22) performs very well at 25°C, easily achieving the advertised specification. The large scatter of the blue points however show that the calibration degrades rapidly with varying temperature. As previously noted, this is my cherry-picked, best AM2302 from a sample of six. In contrast, device K (an HTU21D) seems to lie just slightly outside its specified tolerance at 25°C but has the very substantial advantage of behaving consistently over temperature. In different applications, absolute accuracy at 25°C or a small temperature dependence might be preferable. Easily the best performers though are the BME280 which are both accurate and consistent over the range tested.
To show those differences in more detail I present plots for a single chemical as the temperature is systematically varied. Included are NaCl, NH4NO3 and MgCl. NaCl (RH∼75%) and MgCl (RH∼33%) conveniently span the range of commonly encountered humidity and both exhibit especially small thermal coefficients meaning the humidity should be almost independent of temperature. NH4NO3 lies between the other two (RH∼65%) and is included as a contrast because it is my one chemical with a strong intrinsic thermal coefficient. The humidity axis has been set to a range of 25% in all three plots in order to fairly represent the relative gradients of the lines. Links are also provided to the equivalent three plots in the previous DHT22/DHT11/SHT71 comparison. Devices E, F and SHT71 are the same units there and here. They have remained fairly consistent over the six months between the two experiements.
- Figure 5 is sodium chloride. [DHT22/DH11/SHT71 version]
- Figure 6 is ammonium nitrate. [DHT22/DH11/SHT71 version]
- Figure 7 is magnesium chloride. [DHT22/DHT11/SHT71 version]
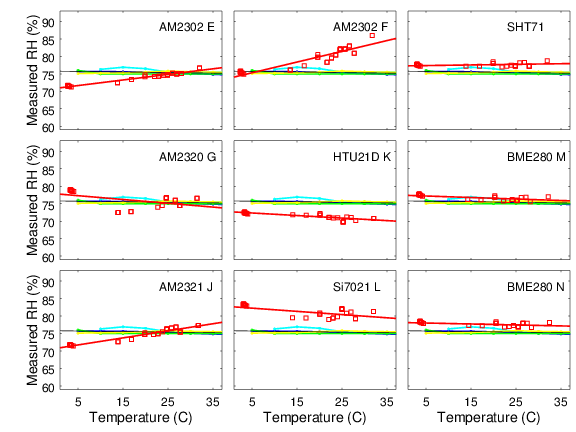
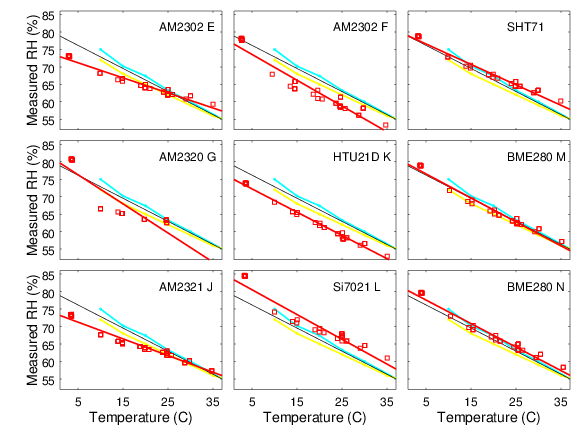
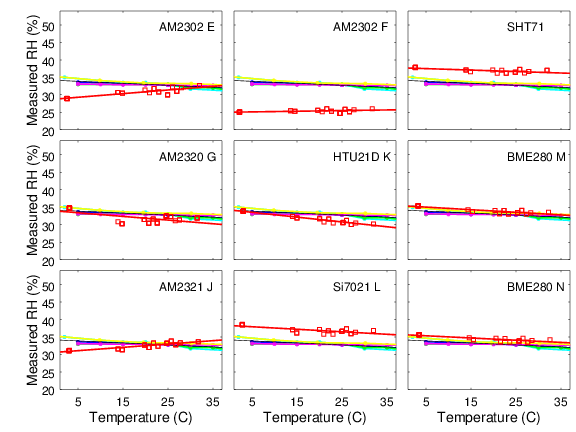
The BME280 shows outstanding calibration throughout. For the other sensors, where the slope of my data matches the slope of the reference data (e.g., NH4NO3 panel K), that device shows good thermal compensation and simply has a constant offset. Where the slopes of the measurements and reference data differ (e.g., MgCl panel K), the device is showing varying errors as the temperature changes.
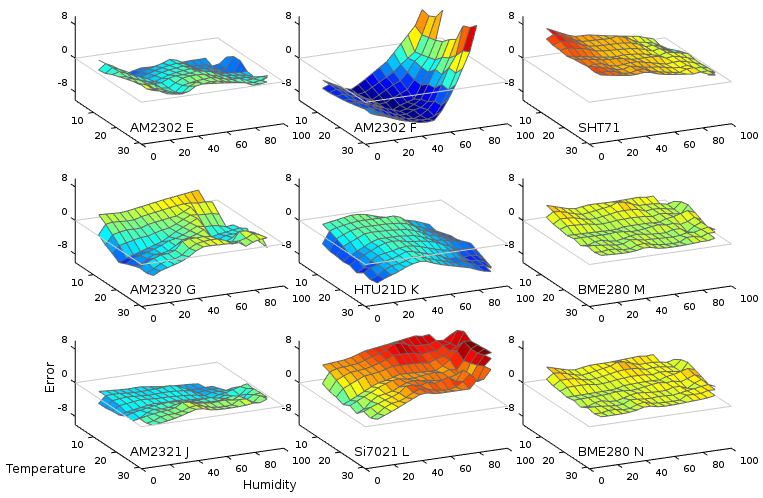
Part 3: As a Function Simultaneously of Temperature and Humidity
Finally, if a sensor is to be used to measure humidity under a range of varying temperatures a full bivariate calibration is required. Such a calibration over the rather moderate temperature range 10 < °C < 35 is shown in Figure 8. The curves in Figure 4 are effectively cross sections through these surfaces.
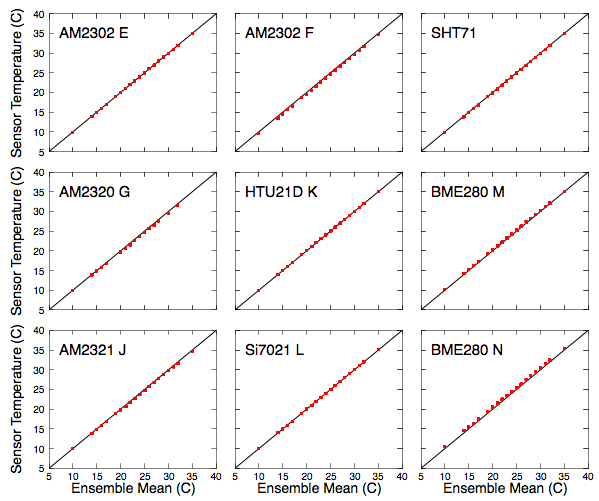
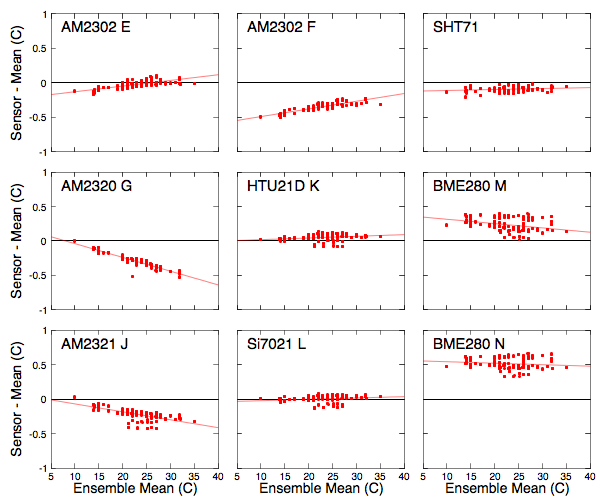
Temperature Accuracy
I am primarily interested in humidity, but present a brief comparison of the temperature values. I made no attempt to establish an absolute temperature calibration and simply compare each sensor to the ensemble average of all nine sensors.
Commentary on Each Sensor
Bosch Sensortec BME280
Within the data obtained here, the BME280 is the undisputed winner. It is the most accurate at the specified 25°C and it shows the least dependence on temperature. It is also the only model for which every device I own performs within specification. The difference is so stark that it leads me to believe the sensing element is in some way fundamentally different from the other devices, but I do not know what the sensing element actually is.
My two BME280s do consistenly read a higher temperature than all the other devices, though I have no absolute reference to say what is correct. What is certain is that the BME280s show more scatter in their temperatures than any of the others. Again I wonder if this suggests the hygrometer is some form of dew point sensor that involves a heating element. In any case, they fulfill the manufacturer's specified 0.5°C tolerance.
AM2302 (DHT22)
In line with previous tests, I would judge the accuracy of my devices to be around 5%. Device E, cherry picked from my set of six, has a calibration at 25°C that is almost the equal of any device ever tested, but it shows a strong temperature dependence when away from thise ideal conditons. Over two years, three of the original six devices have failed.
AM2320 / AM2321
The devices I have tested appear very similar to the DHT22 in overall performance, simply adding the convenience of I2C. Both my AM2320s exhibit the same intermittent fault above around 65% RH. I never got to the bottom of whether this was something wrong in my set up or an intrinsic sensor fault. Currently I am attributing it to bad luck in my getting a couple of faulty devices rather than a systematic fault with this model, particularly given my suspicion that the internals of the AM2320 and AM2321 are almost identical and my AM2321 is working OK.
Sensirion SHT71
Nothing to add beyond my previous experiments with this device. Accuracy seems very comparable to the other sensors apart from the BME280. Temperature stability, which I think it often more important, is equal or better than most. It seems well made and has not yet shown any problems in two years of continuous operation.
Measurement Specialties HTU21D
I have nothing much specific to say about this, but I mean that in a good way. In my tests it did exactly what it was supposed to. The absolute errors were a little larger than advertised, but repeatability was good and the temperature dependence not too severe. It is a nice compact and apparently robust unit, especially with the optional cover screen. Like the Si7021 and SHT71, it seems a solid choice and within the constraints of this test, only having one specimen of each model, I am unable to distinguish any advantage beween them.
Silicon Labs Si7021
I have nothing much specific to say about this, but I mean that in a good way. In my tests it did exactly what it was supposed to. The absolute errors were a little larger than advertised, but repeatability was good and the temperature dependence not too severe. It is a nice compact and apparently robust unit, especially with the optional cover screen. Like the HTU21D and SHT71, it seems a solid choice and within the constraints of this test, only having one specimen of each model, I am unable to distinguish any advantage beween them.
Conclusion
The BME280 delivered easily the best results. The test is potentially unfair though given that they were brand new and are being compared against two-year old DHT22s and SHT71. I have not had much luck with reliability of the DHT22s, but the Sensirion SHT71 has proven itself dependable over two years so far.
If you have comments or suggestions feel free to contact me. robert -AT- kandrsmith.org
References: See here.
Acknowledgments
Though I designed and integrated the entire experiment, I must acknowledge the many open source projects, both software and hardware, that I used.
- I developed my software using the Arduino tools and environment, using some parts of the AdaFruit DHT22/DHT11 library, Brett Beauregard's PID library and Markus Schatzl and Carl Jackson's Sensirion library. Drivers for other sensors were based on datasheets and sample code published by their respective manufacturers.
- My data logger is EmonCMS from the Open Energy Monitor project.
- I am no longer using a JeeNode board, but am endebted to the work of Jeelabs for earlier iterations of this experiment.
- The plots and numerical analysis were generated in Flot, Octave, D3 and Plotly javascript.
- MySQL database, Apache web-server and of course the 10,000+ people who have contributed all across the Linux operating system.
- Javascript for the tabbed menu container around the 3D plots is from Online HTML Tools.
- Finally, thanks to the many correspondents for their interesting discussions and encouragement.
Almost vaguely related and possibly of interest is monitoring radon in the house.
2016-02-29 7:59 PM