[Top level index of all my hygrometer testing.]
Calibrating DHT22 Hygrometers (Version 1)
Introduction
This page accompanies my main DHT22 page and contains a few details of earlier versions of this experiment. The main page describes my best results. Everything herein is obsolete, but has been retained for reference because it describes some of the problems and solutions that led to the current design.
Version 1 Hardware
Version one consisted of a sealed box containing the entire experiment; the sample solution, the sensors, all the electronics and power supply. The idea was to not require any holes for cables into the test cell. This was abandoned because the more there was inside the test cell, the more variables you had to worry about and the harder it was to establish really good equilibrium. It is better for the test cell to be as small as possible and contain nothing other than solution and sensor. Sealing the hole around a cable with caulk is easy enough.
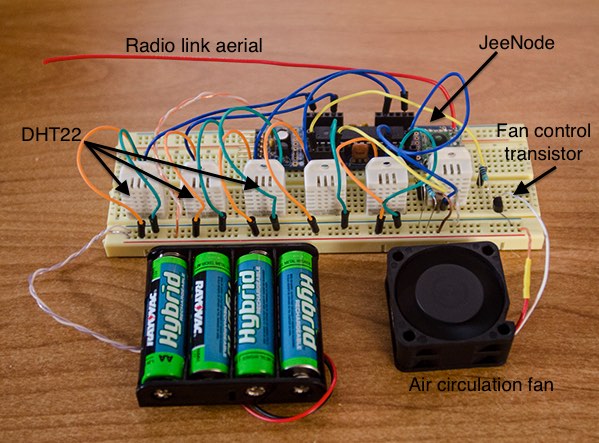
I will not give much detail of the electronic setup. Since these are digital devices which output a calibrated numerical value, the external electronics ought to be irrelevent. Once you provide a d.c. supply voltage, everything else happens inside the sensor module itself. I read the devices using a JeeNoode v6, a small, low power, Arduino-like, ATMega328P board with an integrated RFM12B radio module. The JeeNode's designer provides the JeeLib software library making it very easy to get measurements out of the air tight test vessel wirelessly. Measurements were logged into a MySQL database via the EmonCMS data logging system developed by the Open Energy Monitor project. I enthusiastically recommend the combination of JeeNodes and EmonCMS as an easy way to get going on any wireless, distributed, environmental monitoring system like this.
The entire system was powered from four AA NiMH rechargable cells. The Jeenode has it's own on-board voltage regulator but the supply to the DHT22s was fed directly from the AAs and thus drifted as the battery depleted between charges. The raw supply voltage was monitored continuously and RH measurements only taken when in the range 5–5.5 V. All my DHT22 devices still gave believable results down to 4Vdc, though I know other folk have reported strange results below 5V from some units.
Inside the test cell were
- JeeNode microcontroller board
- Six DHT22 hygrometer/thermometers
- 4AA cells power supply
- A 50mm fan connected to a microcontroller digital output pin via a PN2222 transistor
- Pan containing the sample solution
Constraints and Considerations
Time
Version 1 could take days to reach a good equilibrium, partly because of the larger air volume and many components (see later discussion of hygroscopic materials) but I think primarily it was too difficult to keep at a homogeneous temperature.
Temperature
The single biggest source of error I was able to identify was temperature and temperature stability. There are three different, competing, temperature dependent effects. Most are detailed on the main page. Only a few comments relating to previous failed attempts remain here.
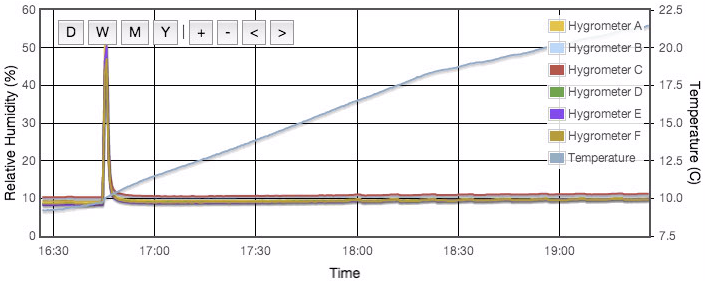
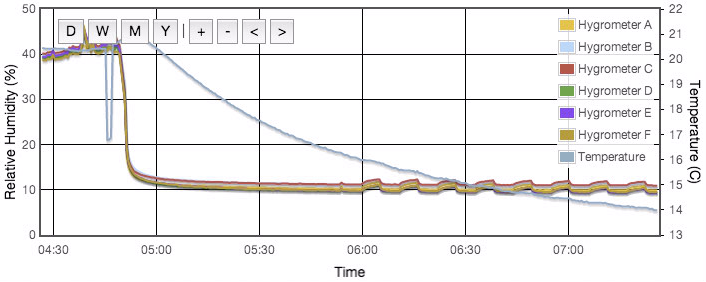
Without active thermal control, the best I was able to achieve was a diurnal air temperature variation inside the test cell of 1°C peak-to-peak. That implies a maximum possible RH variabilty of 5% whereas the thermal variation of salt solubility typically results in variations of well under 0.1% RH. Hence my assertion that choosing salts with small thermal coefficients was pointless. Thermostatic control of the test cell solved this problem, but for version 1 the best I could do was give the test vessel as much thermal mass and insulation as possible. It was buried in a big box of sand and wrapped in blankets inside a closed closet with no air vents into the house. That slowed and smoothed the temperature excursions. The house living space varies daily by 5°C, the air inside the closet by about 3°C and buried in the box of sand, only 1°C. For version 2, active thermal control and lots of forced air circulation proved absolutely necessary.
Air Circulation
Forced convection definitely helps to speed the equilibrium and I also got the impression that a little air movement helps the sensors, possibly because of self heating of stagnant air trapped inside the sensor shroud. I used a small 50mm fan running at low speed inside the enclosure. This takes a lot of power from the battery and also creates heat, something we wish to avoid. The microcontroller was therefore used to cycle the fan on to stir the air and then off for a while. Various duty cycles, running between 10–100% of the time, were tried. Results did not vary much depending on the duty cycle, but I settled on running the fan 50% of the time and a cycle period of ten minutes. Rockland 1960 favoured 20 seconds on and 10 minutes off in order to minimise the heating effect of the fan.
Hygroscopic Materials
Hygroscopy is tendancy of a material to absorb water vapour into its surface and hold it within its molecular structure. Possibly surprisingly, many plastics (e.g., nylon, ABS, acrylic, polyurethane, polycarbonate, PET, PBT) which may be hydrophobic (water will bead on the surface and apparently just run straight off) are in fact hygroscopic (absorb water vapour). This manifests as a sink or source of humidity other than the saturated salt solution, greatly extending equilibration time. If the salt solution is releasing vapour to the air, the walls of the test cell itself could be absorbing it meaning you need to run the experiment for a very long time before equilibrium is eventually achieved. If you then switch to a solution that yields a low humidity, the walls of the test vessel will slowly release that stored vapour back into the air.
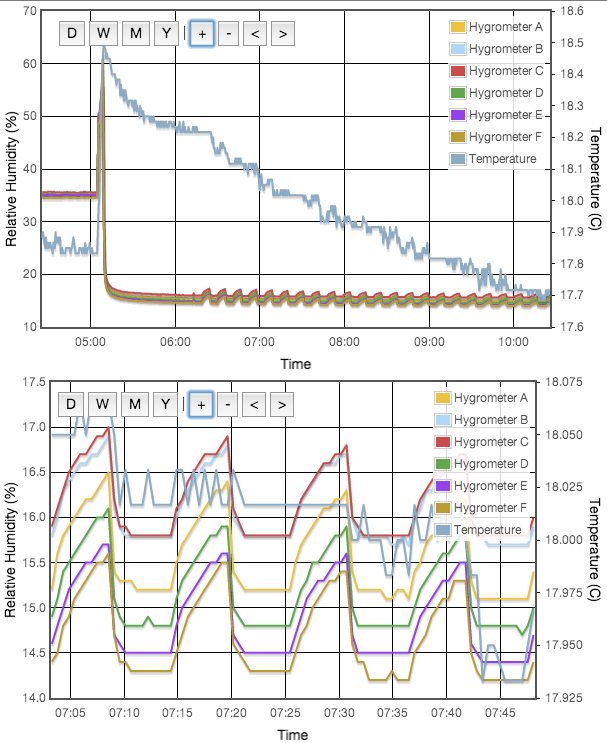
Initially I used a polypropylene plastic tub. Polyethylene, polypropylene, polystyrene and PVC are all generally regarded as non-hygroscopic, but I definitely saw effects. When a new salt was placed in the cell it would take a couple of days to slowly reach a stable equilibrium. If I was then forced to break the seal (to replace batteries for example) the equilibrium would re-establish in just a couple of hours. This I take as evidence that the cell itself needed to reach the equilibrium, not just the air inside. The air got changed along with the battery. The second evidence relates to the fan cycling on and off. Take for example switching from a high humidity to a low humidity salt. When the fan comes on, the measurements would all instantly jump down to a stable value and stay there as long as air was circulating. Once the fan went off, the measured humidity would gradually creep back up; something seemed to be releasing moisture back into the air. The fan duty cycle thus induced an assymetric sawtooth pattern to the plot. The pattern was reversed when moving from a low humidty to a high humidity data point. The measurement value would jump up as the fan came on, stay stable and then slowly drift down when the fan was off as the humidity in the air appeared to be being absorbed by something.
When I swapped to a glass test vessel these problems reduced but were not eliminated. My glass tub still had a polypropylene lid, but I do not know what polymers were used in the manufacture of my breadboard, fan, wires, battery holder etc. It might be worth trying to move as much of that as possible outside the vessel and running wires in through an airtight seal, but what about the sensor housings themselves? They come in a plastic screen sealed with an unidentified resin. Figure 6 provides evidence that something in the cell (breadboard, DHT22 themselves, etc) is hygroscopic. Even if the plastic from which it is made is not itself hygroscopic, it is quite easy to imagine humid air simply being trapped for some time within the structure of a breadboard which would yield a similar effect.
To minimize the problems caused by this, I suggest working systematically through the list of salts from driest to wettest. Jumping around between high and low humidity salts extends the equilibration time at each step. If you can possibly use a glass, stainless steel or other truly non-hygroscopic test vessel, do so. The second generation test cell (all glass and steel with no electical components inside) showed no problems at all.
Version 1 Results
| Salt | Reference | Measured RH % | |||||
|---|---|---|---|---|---|---|---|
| RH % | A | B | C | D | E | F | |
| NaOH | 7.57 | 9.77 | 10.84 | 10.99 | 9.42 | 9.42 | 9.57 |
| LiCl | 12.13 | 14.71 | 15.36 | 15.41 | 15.36 | 13.88 | 13.82 |
| CaCl | 33.49 | 35.3 | 35.21 | 35.59 | 35.18 | 35.03 | 34.51 |
| MgCl | 33.31 | 35.22 | 35.01 | 35.29 | 34.98 | 34.75 | 34.28 |
| KCO3 | 43.75 | 46.31 | 45.93 | 46.42 | 46.29 | 47.14 | 45.59 |
| NH4NO3 | 67.35 | 69.30 | 68.01 | 68.68 | 69.07 | 70.03 | 70.50 |
| NaCl | 75.32 | 76.9 | 75.0 | 76.3 | 75.6 | 77.9 | 76.0 |
| NH4SO4 | 80.17 | 82.2 | 79.9 | 81 | 81.6 | 83.7 | 82.5 |
| KCl | 85.09 | 87.9 | 85.6 | 86.4 | 87.7 | 88.6 | 90.7 |
| K2NO3 | 93.24 | 96.6 | 92.9 | 95.0 | 95.9 | 99.9 | 99.9 |
| H2O | 100.00 | 99.9 | 99.4 | 99.9 | 99.9 | 99.9 | 99.9 |
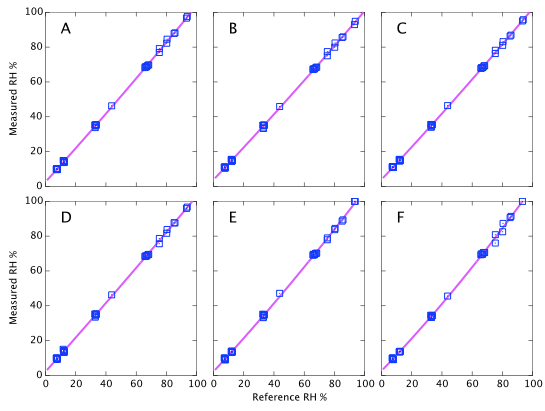
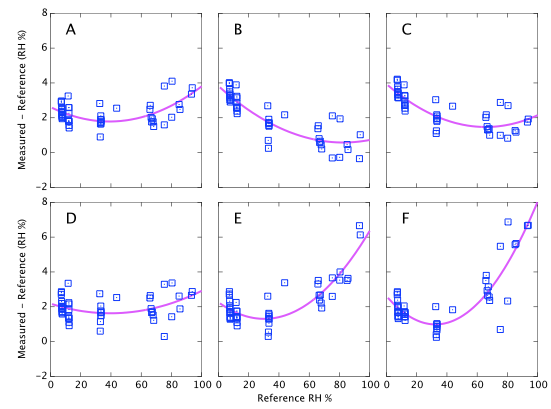
Figure 8 above essentially represents the main conclusion of the experiment. Devices A & D consistently read about 2% high. Devices B & C read 4% high when dry but tend towards quite accurate at high humidity. Devices E & F read slightly high when dry but deviate quite strongly (up to 6% absolute error) at high humidity. I reiterate that this does not yet represent the temperature dependence of these devices which, though not yet fully investigted, is clearly at least 2% RH. Repeatability (on time scales of a few weeks) is about 1% RH as specified (Figure 9).
Future Plans
Possible future extensions of this work:
- Compare to the DHT11 which has highly inferior specs and is much cheaper. I have already bought one, but not yet tested it. Done in version 2
- I have started looking into active thermal regulation. Done in version 2
- Move all the electronics (especially the breadboard) outside the test cell. Done in version 2
- Repeat for the same devices described here. Done in version 2
- Try another batch of sensors with very different serial numbers