Absolute Calibration of DS18B20 Thermometers
Or, an excuse to play with liquid gallium
Introduction
Though most hygrometers integrate a thermometer in the same package, my hygrometer calibration write-ups have generally not attempted to test their absolute temperature accuracy. There is one write-up looking at absolute temperature calibration of the BME280 which was good to better than the ±1°C specification. For this experiment I extend that work to test the accuracy of the DS18B20 which promises ±0.5°C over the range −10 to +85°C.
This experiment is not really intended as a practical method for routine testing or calibration of thermometers, though it may be a proof of concept for that. Primarily it focuses on whether it is even possible for me to achieve a true absolute calibration with my simple home-made equipment. Secondarily, once we have shown it should be possible, I test the absolute accuracy of some DS18B20s as an example.
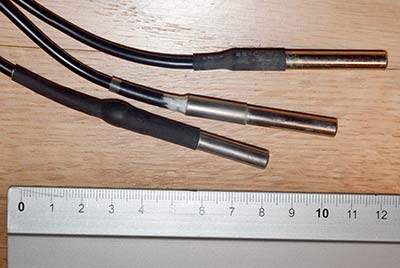
The devices being tested are low cost, encapsulated DS18B20s where the device has been potted into a stainless steel sleeve as shown in Figure 1. Such devices are widely available from many online retailers. I am using the same three devices (serial numbers 28:FF:8F:39:A1:15:04:18, 28:FF:5E:39:A1:15:03:08, 28:FF:93:4C:A1:15:03:EF) as described in my BME280 calibration test and are designated here as DS18B20-4, DS18B20-1 and DS18B20-3 respectively.
My aspiration for this experiment is to achieve a thermometer accuracy of ±0.1°C over the range 0–100°C.
Method
The conventional method for calibrating thermometers is via a traceable reference thermometer. You simply take a known good thermometer and compare it against the device under test. To do this properly, the 'known good' thermometer should be from a manufacturer who has calibrated it against their own carefully maintained reference thermometer. The manufacturer's reference is in turn checked against a reference device at some reliable, independent, laboratory, normally the national, publicly funded metrology institute. That metrology institute has ultimately performed an absolute calibration from fundamental physical references to calibrate their own reference thermometer. In this way your calibration is 'traceable' back up an unbroken chain to a fundamental physical reference. A proper traceable reference thermometer is of course expensive and to maintain its certificate will need to be routinely re-calibrated.
That is the sensible and practical method and is not what I am describing here. I am interested in trying to perform the fundamental calibration for which you normally rely on the national standards laboratory. For an account of a practical DS18B20 calibration, see Edward Mallon's detailed and very well written blog post for the Cave Pearl Project.
The current internationally agreed definition for the temperature standard is ITS-90 (Preston-Thomas, 1990). Following this in its entirety is impractical. It involves highly specialised laboratory equipment and expertise as well as ultra-pure helium-3, hydrogen, neon, oxygen, Argon, mercury, water, gallium, indium, tin, zinc, aluminium, silver, gold and copper. However two of the seventeen defining reference points in ITS-90 do fit my needs. The reference points based on water and gallium may be attainable.
To get a good calibration up to 100°C, ideally I would also include the indium reference at 156.5985°C. However, not only does that exceed the operating range of the DS18B20 (<125°C) but the specified procedure for measuring the freezing point is more complicated than that for melting point. Gallium uses an apparently simpler melting point procedure. It does however mean my calibration will include substantial extrapolation from 30 to 100°C.
Water : 0°C
ITS-90 defines the triple point (temperature at which ice, liquid water and vapour co-exist in equilibrium) to be 0.01°C. The ice point (temperature at which ice and liquid water co-exist in equilibrium) has not been a defining reference point since the adoption of ITPS-68 (Comité International des Poids et Mesures, 1976), but at the precision I am interested in for this experiment, the ice point of pure water may be taken as precisely 0°C. See BME280 Absolute Temperature Accuracy for more discussion of the validity of this reference point, effects of atmospheric pressure and contamination, and the method for creation of an ice bath.
Water : 100°C
A brief comment on why I have not included the steam point of water as a calibration point. Within the context of this experiment which is specifically attempting to apply ITS-90, the steam point of water is simply not one of the seventeen fundamental references. (Nor is the ice point, strictly speaking.) More practically, I have tried several times in the past to use the steam point as a reference and never acheived satisfactory results. I have not been able to achieve reproducability to better than a few tenths of a degree. If I cannot even reproduce my own measurements in repeated experiments then I certainly cannot base a calibration on those measurements. The Results section below shows repeatability for the ice point determination at the level of a couple of hundredths of a degree. If I were starting from an uncalibrated device with unknown errors, then boiling water would be an important contribution to providing a practical calibration. In this case however I do not believe I can generate a reference that is confidently better than the factory calibration, so it provides no value.
Gallium : 29.7646°C
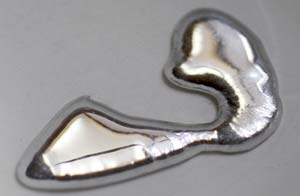
ITS-90 defines the melting point of gallium at standard atmospheric pressure to be 29.7646°C. (See image of liquid gallium at the head of the page.) This is the only other defining reference point that it appears straight forward for me to use.
Gallium is generally regarded as non-toxic though there are some reports of dermatological reactions and gloves are recomended for handling, not least because it tends to be messy and sticks to just about everything. Wearing gloves prevents skin oil contaminating the gallium. Maintaining chemical purity is very important and discussed further below. Gallium is not particularly reactive, but do not to let it contact anything aluminium. Gallium will dissolve aluminium so do not attempt use a thermometer that includes aluminium components!
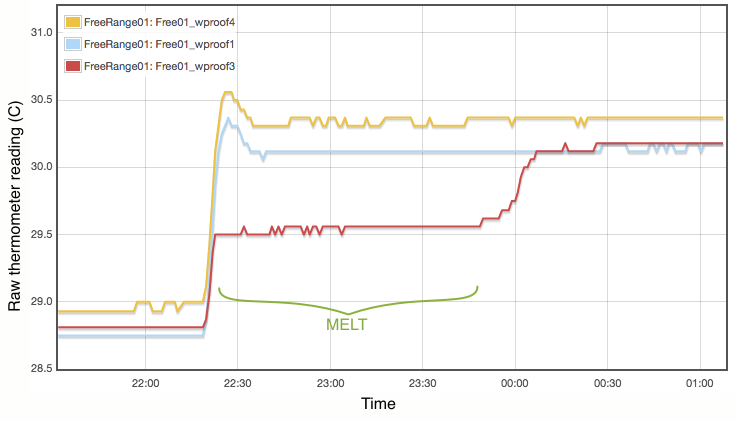
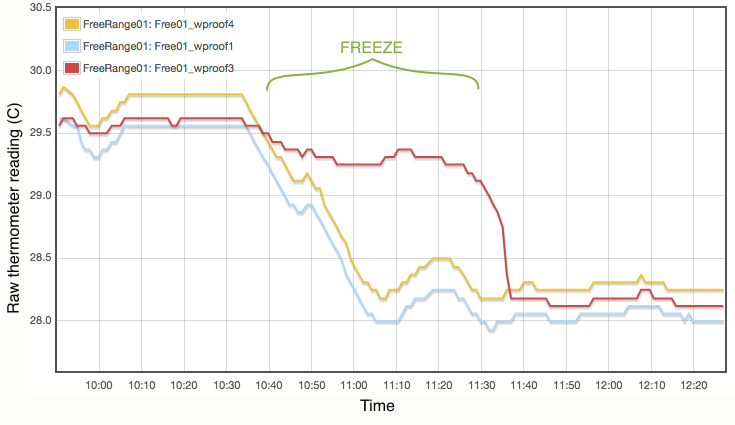
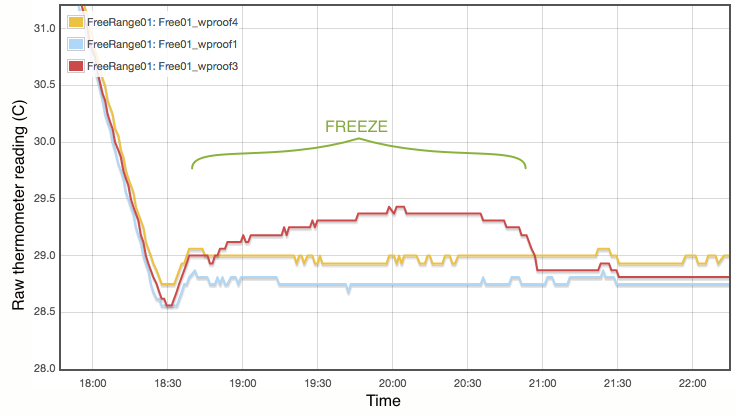
My procedure for measuring the melting point is extremely simple and does not come close to following the strict laboratory procedures that would be expected under ITS-90. Proper commercial gallium cells cost in excess of $3000 and consist of annular units, sealed at 1 atmosphere pressure and to maintain gallium purity, with the thermometer inserted into a central cavity. I have simply used an open test tube with 20g of gallium, suspended in a carefully regulated water bath. The thermometer was first frozen into the solid gallium and then the water bath adjusted to just above the melting point. As shown in Figure 2, the temperature inside the block of gallium climbs with the water bath until the melting point is reached. The temperature of the melting gallium then plateaus and remains constant though the water bath temperature continues to rise. During this plateau, energy is being absorbed by the gallium as it transitions from solid to liquid. Only when the sample has fully melted will the temperature of the liquid gallium again rise and equalise with the surrounding water bath. Using a proper gallium cell containing 1kg of gallium, professional standards labs can maintain the melting phase change continuously for periods exceeding a month (Strouse, 2014). With my very simple apparatus and 20g of gallium, my melt plateau typically lasted only about one hour (Figure 2), but that is plenty long enough to get a robust measurement, averaging one data point per minute. The water bath was then cooled to freeze the gallium (Figure 3) and the process repeated. Each thermometer was exposed to at least three melts.
Lastly I note that constructing a proper gallium cell is really not unreasonably complicated. There is nothing especially elaborate about it. I was not inclined to do so primarily because I do not believe the purity of my available gallium sample is high enough to merit it. As discussed below, reasonable assumptions about the contamination of my gallium sample lead to uncertainties of at least 0.01°C, which is not even remotely comparable to the 0.00005°C errors quoted for the NIST gallium cells. If you did want to routinely calibrate thermometers using this method, putting together a re-usable gallium cell should be quite possible.
Gallium Purity: Leaving aside the practicalities of being able to set up apparatus to measure the melting point, by far the largest probable source of systematic error for my test is the purity of the gallium. NIST Special Publication 260-157, 'Standard Reference Material 1751: Gallium Melting-Point Standard' (Gregory F. Strouse, 2004) describes creation of gallium cells using 99.999996% pure gallium. I am not willing to pay for that purity, but samples claimed to be 99.99% are widely available from internet retailers. The NIST sample employed an emission spectrographic assay to precisely identify the contaminants. Again that is not available to me so I will simply assume the contamination of my sample is of similar composition but proportionately much greater. That is probably not true since different contaminents likely have greatly differing levels of ease with which they are removed by the refiner. Using a simplified form of Raoult's Law of dilute solutions and Blagden's Law of freezing point depression NIST document 260-157 shows the adjustment to the melting point is linear with total molar fraction of all contaminants. Since their assay gave 99.999996% and my sample is supposedly better than 99.99%, my sample contains ∼2500 times as much contamination. For their assay, they calculate a 3.85×10⁻⁸ mole fraction impurity concentration, so I estimate 2500 × 3.85×10-8 = 9.6×10⁻⁵ for my sample. Again following the same procedure as NIST document 260-157, the first cryoscopic constant for gallium is 0.00732 and the prediction for the depression of the melting point in my 99.99% purity sample is 9.6×10⁻⁵ / 0.00732 = 1.315×10⁻³°C or 13 mK. The dilute solution of contaminants generally always lowers the melting point and I predict the melting point for my sample as 29.7647 - 0.013 = 29.7516°C.
An alternative question would be how much worse can my gallium be than the advertised 99.99% purity before errors approach my desired 0.1°C tolerance? Depression of the melting point by 0.1°C requires a contaminant molar concentration of 0.1 × 0.00732 = 0.000732. Again using the very crude assumption of this sample having the same types of contamination as the assayed NIST sample, that would require a sample with 19,000 times the contamination of the NIST sample, or 99.9% purity. In the absence of any direct measurement I can reasonably hope that my sample is not a factor of ten worse than advertised. That is true of the new sample at its first use, but long term and with significant handling, it might accumulate 0.1% contamination.
Atmospheric Pressure: The melting point of gallium is defined as 29.7646°C at standard atmospheric pressure of 1013.25 hPa. Since I live at above 5000 feet altitude a correction must be made. The ITP-90 specification (Preston-Thomas, 1990, Table 2) gives the effect of pressure as −2.0×10⁻⁸ K Pa-1. For my local atmospheric pressure at the time the experiment was performed (824hPa), this modifies the melting point by +0.38mK, or +0.00038°C.
As an aside, note the minus sign in that pressure dependence of −2.0×10⁻⁸ K Pa-1. The phase diagram of gallium (Young, 1975), like water, is slightly unusual in that around one atmosphere, increasing the pressure decreases the melting point. Also, the fact that gallium expands, rather than contracts, as it freezes is why gallium is the only material in ITS-90 to use the melting point rather and freezing point. If you measure the freezing point of gallium you risk the expansion, constrained by the test cell vessel, causing internal pressure changes that affect the freezing point and the very act of solidfying could itself change the freezing point in unpredictable ways.
Hydrostatic Pressure: The hydrostatic head of gallium in the cell causes the pressure at the bottom of the test cell to be greater than at the top. The reference melting point would only be perfectly achieved at the gallium surface in one atmosphere. Again the ITS-90 specification (Preston-Thomas, 1990, Table 2) provides the required correction as a function of depth in the gallium as −1.2×10⁻³ K m-1. Given that my thermometer is immersed only about 3cm in the gallium, the expected error is a completely negligible −0.036 mK or −0.000036°C.
| ITS-90 definition | +29.7646 |
| 0.01% impurity | −0.013 |
| Atmospheric pressure | +0.00038 |
| Gallium depth | −0.000036 |
| Expected melting point | +29.7519 |
The pressure effects are clearly irrelevant to my stated goal of ±0.1°C. The impurity is more difficult. Given that I do not have a specific assay I do not know how accurate the advertised 99.99% purity really is. Clearly it is not a specific measurement of my sample. This particular refiner may specify an average value (and mine has a 50% chance of being worse) or it could be a quality acceptance criterion limit with many refinery batches actually being significantly better. For this two-point calibration at 0 and 29.8°C, a systematic error of 0.013 at 29.8 becomes 0.043 error when extrapolated to 100°C, so I can achieve my target accuracy either way. Given that my sample must contain some level of contamination it seems prudent to apply the correction. I will assume the true melting point in my aparatus to be 29.7519°C.
Results
Ice point
An ice bath test was performed three times as detailed in BME280 Absolute Temperature Accuracy. The results from the first two runs were reported in that previous document. Those were used and supplemented here by a third run with the same equipment several weeks later. For 'Run 3' the data are an average of 24 hours in the ice bath, logging values once per minute.
| Device | Run 1 (°C) | Run 2 (°C) | Run 3 (°C) | Average (°C) |
| DS18B20 4 | −0.369±0.03 | −0.370±0.03 | −0.370±0.03 | −0.370±0.02 |
| DS18B20 1 | −0.488±0.03 | −0.488±0.03 | −0.443±0.03 | −0.473±0.02 |
| DS18B20 3 | −0.291±0.03 | −0.284±0.03 | −0.310±0.03 | −0.295±0.02 |
Gallium melting point
| Device | Average (°C) | Offset (°C) |
| DS18B20 4 | +29.560±0.001 | −0.192 |
| DS18B20 1 | +29.351±0.016 | −0.401 |
| DS18B20 3 | +29.551±0.006 | −0.201 |
The Two-point Calibration
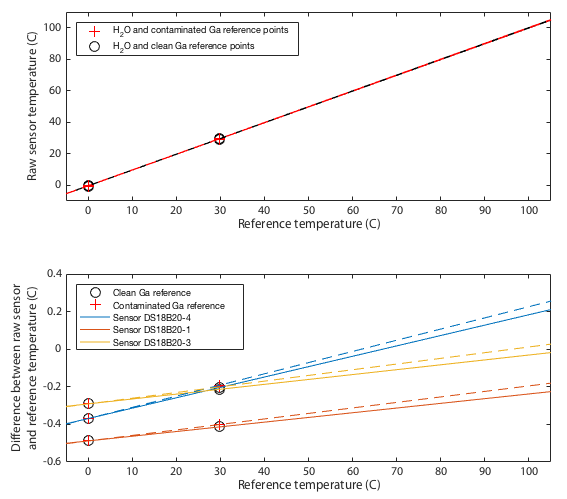
Deriving an updated calibration for each sensor is simply a matter of performing a linear fit to the data in Tables 2 and 3. The resulting fits are shown in Figure 4. This should be robust between 0 and 30°C, but from 30–100°C we are simply assuming the manufacturer's original calibration was linear and we extrapolate. If you choose to believe these data, all three sensors tested read low at low temperatures and approach 'correct' around 80–120°C. All three are within the manufacturer's specification of ±0.5°C with sensor 1 being the only one to approach that limit.
Testing the Calibration
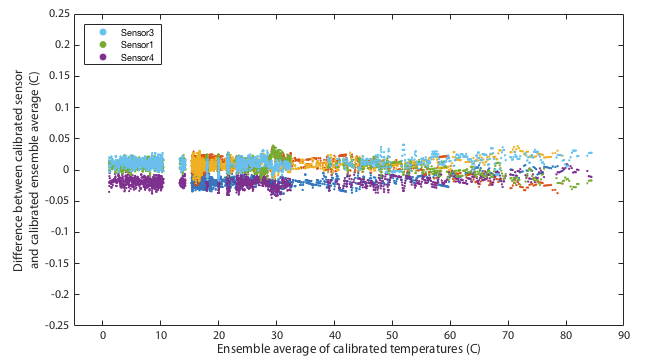
It may be impossible to prove that this calibration is actually better than the original factory settings. Ultimately any calibration comes down to simply trusting a reference source. We can however increase our confidence by performing multiple independent tests and at least demonstrate that the results are mutually consistent. One way I do that is to place all three thermometers together in a water bath and monitor the relative offsets between the three sensors. The hypothesis is that uncalibrated, when we go above 30°C, the three thermometers should diverge in the manner shown in the lower panel of Figure 4. Further, we predict that after applying the calibration, the three thermometers should mutually agree better than they did before. Figures 5 and 6 show results of this test. The same water bath was used as before but this time with no active temperature control. It was simply filled with water at 80°C, thoroughly wrapped in insulation, and left to cool slowly to ambient temperatures over a period of about a day. This was performed twice as a consistency check. An aquarium pump circulated water continuously throughout. For low temperatures the bath was filled with ice water and again allowed to passively warm to ambient. Remember that for this test we have lost all absolute calibration and can only compare each sensor to the ensemble average of all three to ask how well they agree, not how well they are correct.
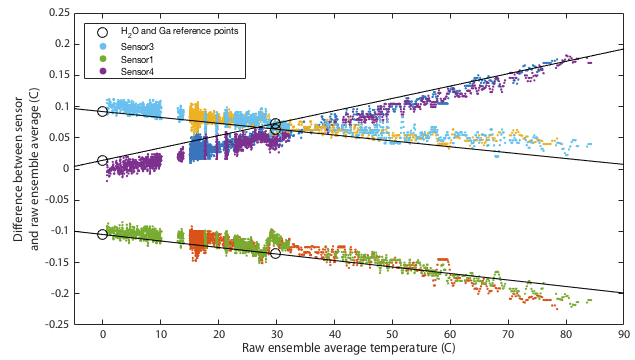
Though it remains within specification, sensor 1 seems distinctly poorer than the other two, exhibitting several minor problems. It is the only one to approach the 0.5°C tolerance in the absolute calibration of Figure 4. It has a odd, though small, wiggle around 30°C and it is the only one that shows any curvature to its cooling curve in Figure 5, meaning that it is very slightly non-linear.
This is not quite as powerful a demonstration as it might appear. The ice and gallium calibration points must simply force the three curves to agree at 0 and 30°C. If the three devices being tested had all exhibited the same slopes in Figure 4 then this would have been an arguably weak test because my calibration would have amounted to nothing more than applying a constant offset to each device. In that case I can show that I make the devices better agree, but it is not obvious that the offset is a nett benefit. The fact that my fit for device 4 has a very different gradient is a significant advantage. It would require some degree of unlikely conspiracy for my two-point calibration to apply a scale error correction that when extrapolated all the way up to 80°C improves agreement between sensors and yet degrades the overall accuracy.
Conclusions
- The factory calibration for all devices tested was within specification. No devices were faulty though sensor 1 is markedly less good than the other two.
- I currently have no practical application whatsoever that merits the effort expended here or requires better than the factory calibration.
- Gallium is fun.
- Repeated measurements show reproducabilty for both ice and gallium at the level of a couple of hundredths of a degree.
- Based largely on the results' stability and reproducability I do believe that the two point, ice and gallium, calibration presented here is able to improve on the DS18B20 factory calibration.
References:
Some of these papers are in academic journals which require pay subscription access, so you may only be able to read the abstracts on-line.
- Comité International des Poids et Mesures, 1976, Metrologia 12, 1, pp. 7-17 "The International Practical Temperature Scale of 1968. Amended Edition of 1975"
- Preston-Thomas H., 1990, Metrologia, 27, pp.3-10, "The International Temperature Scale of 1990 (ITS-90)"
- Strouse G.F., 2004, NIST Special Publication 260-157, "Standard Reference Material 1751: Gallium Melting-Point Standard"
- Young D.A., 1975, "Phase diagrams of the elements", p.22. [URL]
Acknowledgements: See here
If you have comments or suggestions feel free to contact me:
2017-03-26 9:07 PM